| "White rabbits, white rabbits, please bring me good luck." That, as I recall, was the childhood rhyme we were supposed to say at the beginning of each month. After years of covering macro markets, with the splurge of new data that comes at the beginning of each month, the doggerel seems more and more apposite. The first half of the year saw optimism about growth and fear of inflation rise together, and then slip back again together. Economic data remain profoundly affected by the shock for the ages that arrived a little over a year ago, and it can seem almost a matter of luck whether the next data download will help or hinder the positive narrative. The two questions we want to answer are: Will the economy keep growing, and will inflation rise faster than central banks expect? Naturally, they are connected, while perceptions of the answers will affect the eventual outcome. On growth, there is little or no doubt that the U.S. economy is still expanding, but it appears that its speed is declining. As this change at the margin is what matters to markets, that could imply a slowdown or worse for stock markets that are priced for perfection. Thursday will bring manufacturing supply manager surveys from around the world, generally regarded as the most reliable leading indicators out there, followed on Friday by U.S. non-farm payrolls. The data themselves, and not just the reality they describe, can be erratic. The ISM manufacturing numbers suggest that the U.S. hit a peak two months ago, and has declined a little since then. They aren't expected to change much. Regional surveys by Federal Reserve banks conducted since that last ISM survey similarly suggest that Peak Growth has arrived and that improvement is now slower — although they are still very positive. The absolute levels tend to be less important than the direction of travel, and on this the Philly Fed and Empire State surveys, of the Philadelphia and New York regions, are consistent: 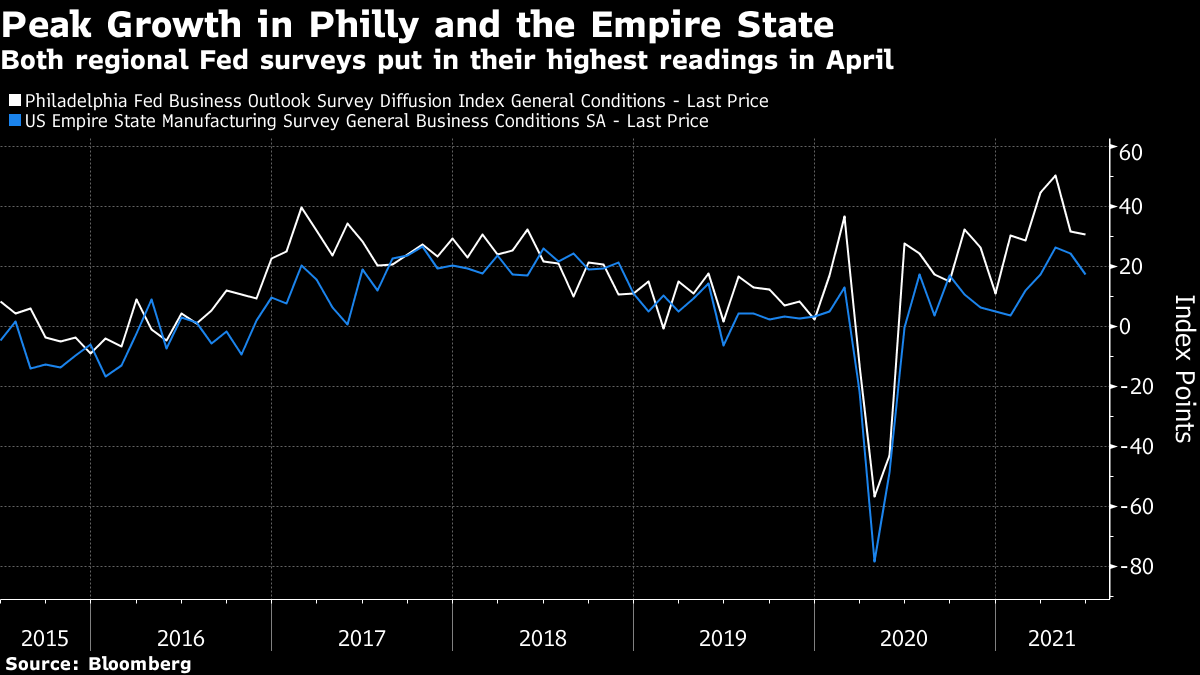 Most recently, the Market News International Chicago PMI, having recorded its best reading in half a century in May, sprang a nasty downside surprise earlier this week. The number was down, and sharply below expectations. 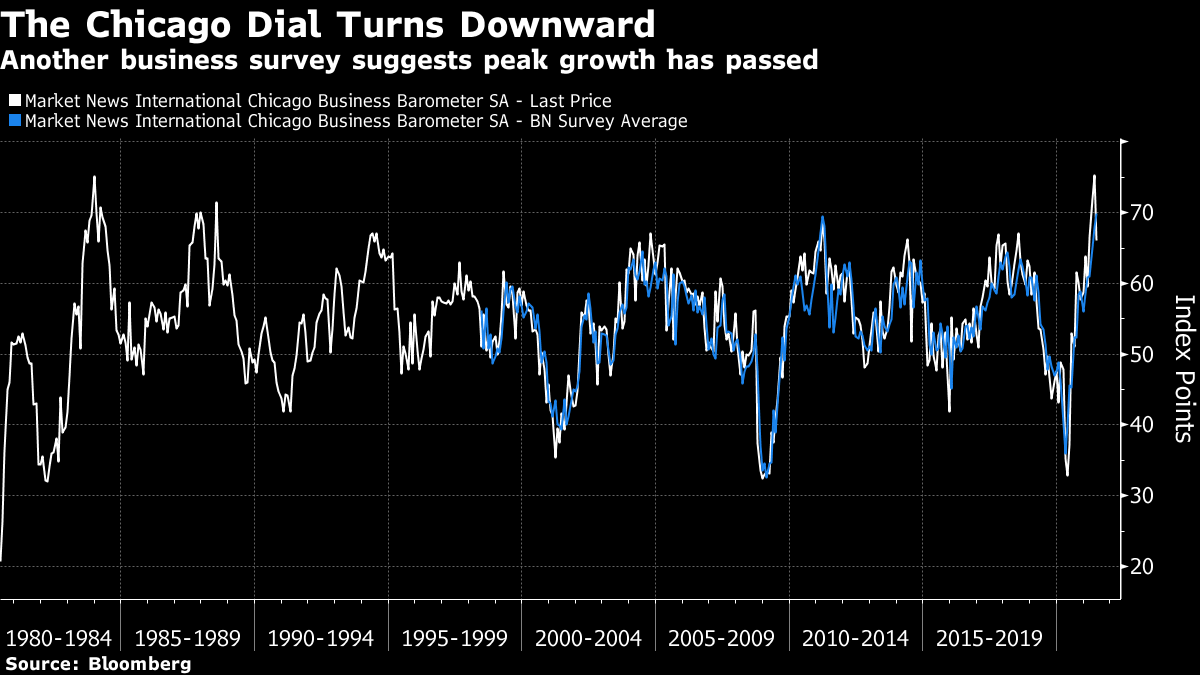 Given the current optimism in markets, any further fall in the headline ISM would not be well received. UnemploymentThe best-known leading indicator for the non-farm payroll data comes from the survey conducted by ADP, the payroll service. The latest ADP readout suggests that reopening is moving into the sectors worst hit by the pandemic shutdown, with almost half of the 692,000 new jobs it found being created in the entertainment and hospitality industry. That said, the ADP numbers can be an unreliable guide. This is how the change in payrolls has moved month by month over the last year, according to ADP and to the official non-farm payroll data, with the ADP more optimistic seven times, and more pessimistic the other five: 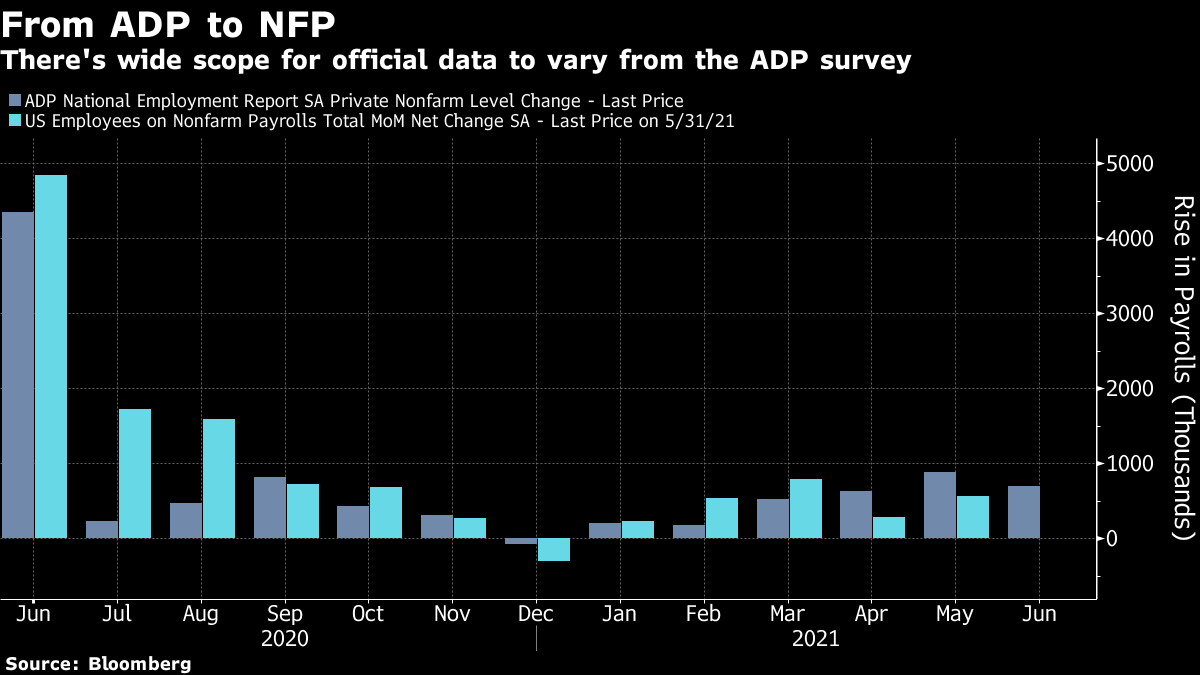 Other indicators suggest there are plenty of jobs available, although it might take some time to fill them. The Conference Board's survey on consumer confidence arrived earlier this week, and found the number of people reporting that jobs were easy to find at a historic high, compared to those who said they were scarce: 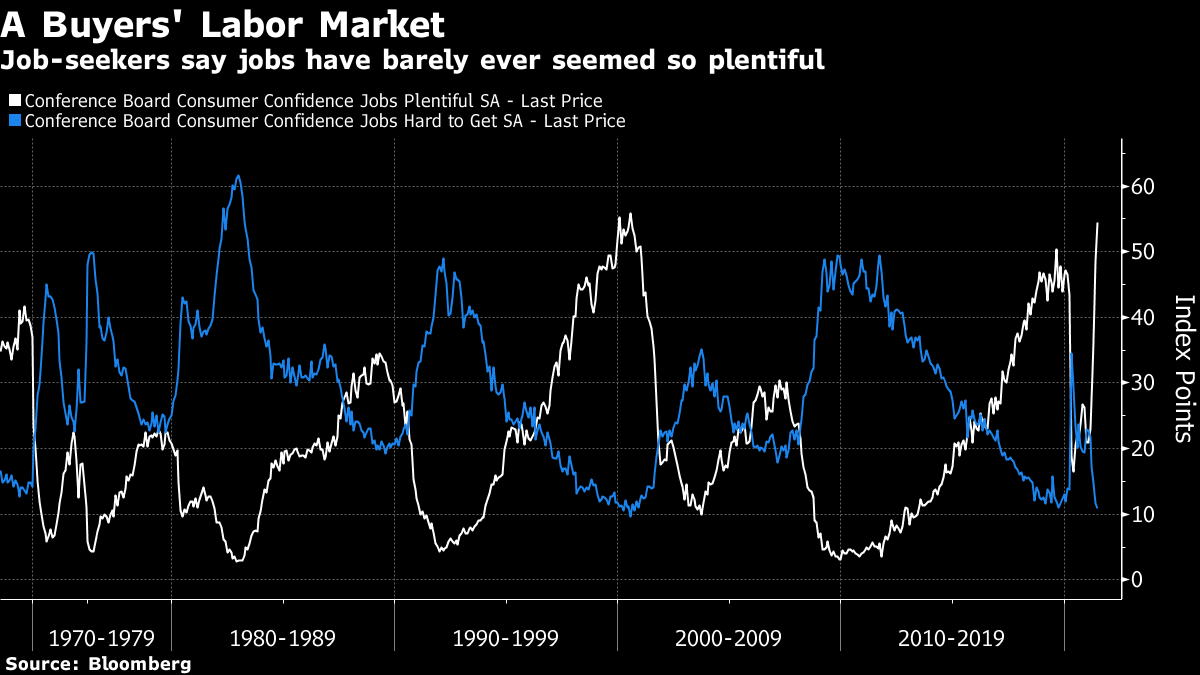 This improvement is rapid, and suggests we should brace for yet more noisy data. Reopening companies are now confident enough to advertise vacancies once more, but they may not be able to fill them all at once. Research from Oxford Economics suggests that although there are plenty of jobs, and plenty of people who'd like one, the matching process could take a while. Most sectors of the economy have fewer than one unemployed person for each vacancy: 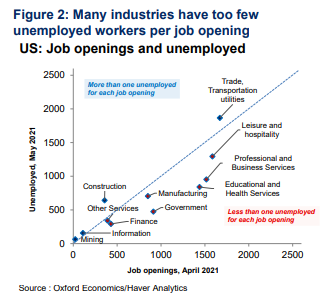 Is this due to the famously generous unemployment benefits being paid out to tide people through the pandemic? Yes, in part, but not to the extent that some might think. As Oxford Economics shows, there is a relationship between a state's payroll growth and the amount of the average week that it covers in benefits, but only a weak one: 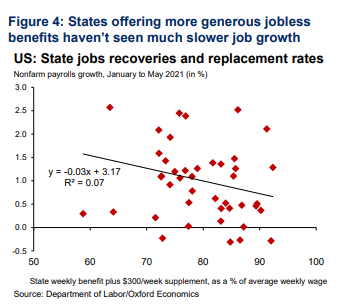 Of more significance is progress against the disease, and relaxation in pandemic-related restrictions. Oxford's number-crunching shows that, as might be expected, job growth follows the lifting of restrictions in a state, with a lag of some weeks: 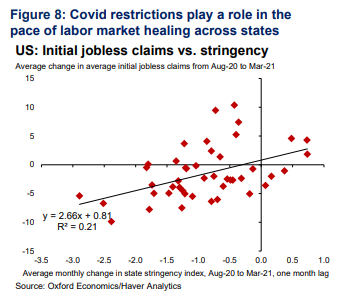 As progress in the fight against the pandemic continues to be what the late Donald Rumsfeld would have called a "known unknown," so the speed with which unfilled jobs can be filled is also unknown. We should brace for misleadingly noisy numbers. InflationThe greatest interest in unemployment data centers on the implications for inflation. This appears to be the best "buyers' market" in decades, with far more negotiating power for applicants. That should, in theory, mean upward pressure on wages, which could lead to inflation. That at least is the implication of the Conference Board's survey. However, the link isn't strong. This chart shows the balance between those finding jobs easy and hard to find in the Conference Board survey, and the headline inflation rate: 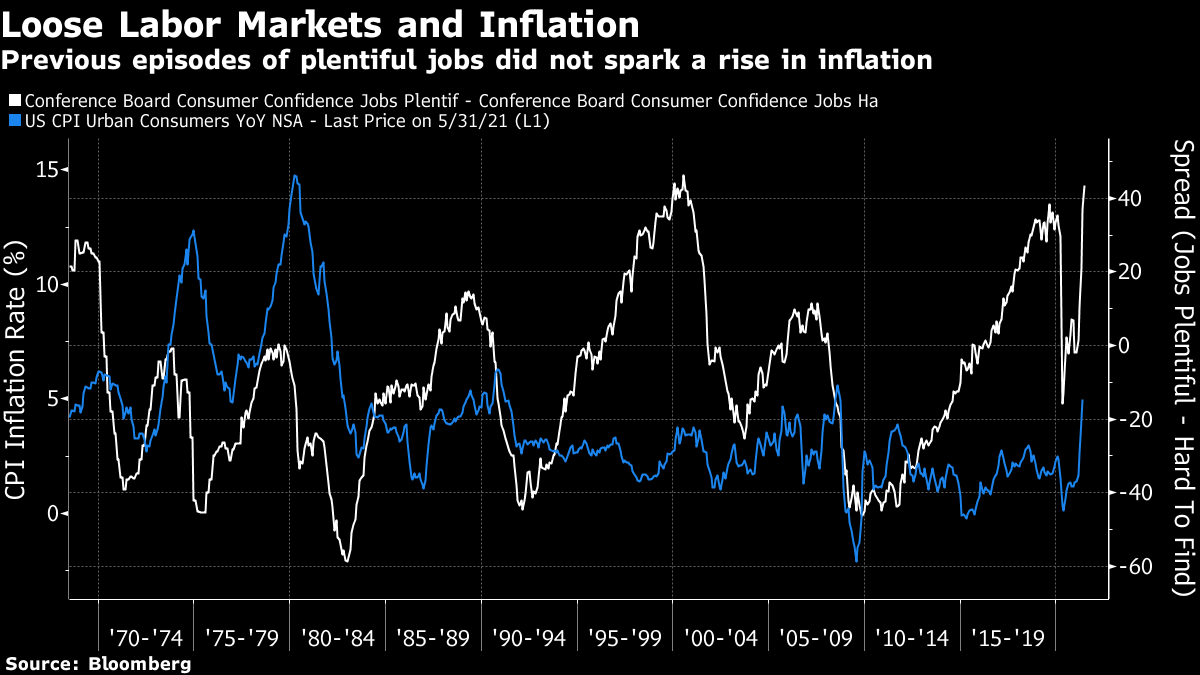 A relationship was once dimly discernible, but has been gradually squeezed away over the last three decades as non-inflationary psychology has taken hold. Psychology matters, and is difficult to measure; it's based on asking people how they feel. But the evidence so far, such as it is, suggests that inflationary psychology may be starting to return. The Conference Board also asks about people's inflation expectations, which are almost always higher than the actuality. It's nevertheless notable that consumers' expectations for inflation over the next 12 months continue to rise. If people are braced for inflation to last, rather than for a transitory increase, that implies they will be that much more bolshie in their wage demands, which in itself will increase price pressures. 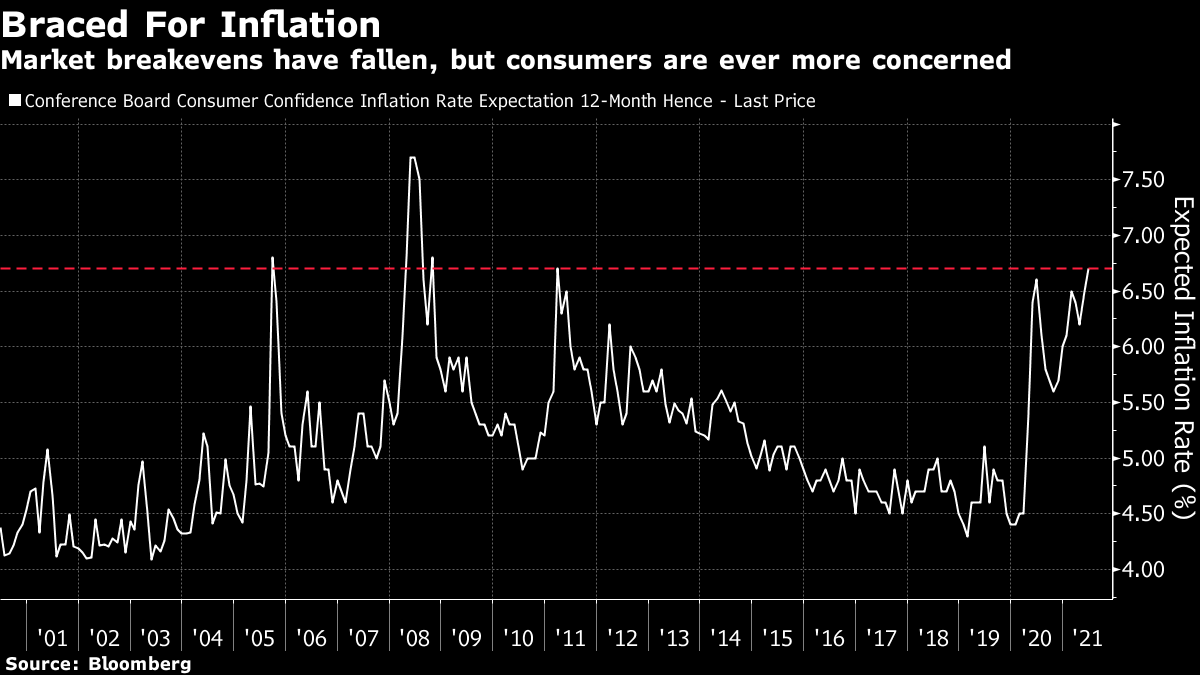 It's possible that the beginning of July will leave everyone much more confident and relieved, but it's also possible that it could send everyone off chasing a wild goose in one direction or another. In these circumstances, it is probably best to put less emphasis on any single piece of evidence, and least of all on the most surprising data outliers, even though our natural inclination is to do the opposite. It's also best to assume that it will take a while for the post-pandemic mess to sort itself out. On this note, I commend the comments that Jonathan Golub, equity strategist at Credit Suisse Group AG, published earlier this week. What follows is very true: It is incumbent upon fiscal and monetary policy makers, business leaders and investors to forecast the future. They use quantitative models to chart the path forward: to project employment, interest rates, economic growth, profit margins and stock multiples. Unfortunately, these models—built upon historically normal relationships—break down in periods such as this. The disparity of forecasts captured in the Fed's dot plots highlights how challenging it is to ascertain this future trend. This difficulty is also apparent in the enormous 734k miss in April Payrolls (266k actual vs. 1 million consensus) and the 30% surprise in 1Q21 results (50% EPS growth vs. 20% consensus). In such an environment, investors are forced to place less weight on any specific piece of data, focusing instead on a larger mosaic. The muted response to both the Jobs report and 1Q21 earnings are evidence of this phenomenon... We believe that inflation, while transitory, cannot dissipate until supply chain and other post-pandemic disruptions resolve themselves. We find it hard to believe this will occur before Labor Day, or even Christmas. Put differently, we see transitory as much more protracted.
A Year of Two HalvesFor those uninitiated into British soccer, there is an old cliche that football is a game of two halves. In soccer, the players go off for a break at the halfway point. In investing, there is no break, and trading will continue on July 1 as it did on June 30. But as there is a need to divide things into halves, let me offer two key facets of the first half in markets. First, this was the half when everyone braced for a taper tantrum, and it didn't happen (even after giving strong signs in January and February that it would). In the following chart, I've mapped the 10-year real yield since Jan. 1, compared with the 10-year real yield started on April 1, 2013, when Ben Bernanke's comments about tapering asset purchases would soon drive an explosive rise in real rates from historically low levels. At one point it looked like 2021 might stage a repeat, and then it began to look as though the 2021 tantrum was over and had been much milder than its predecessor. At this point, with real yields having wandered downward for more than three months, it's probably more accurate to say that we haven't had a tantrum at all: 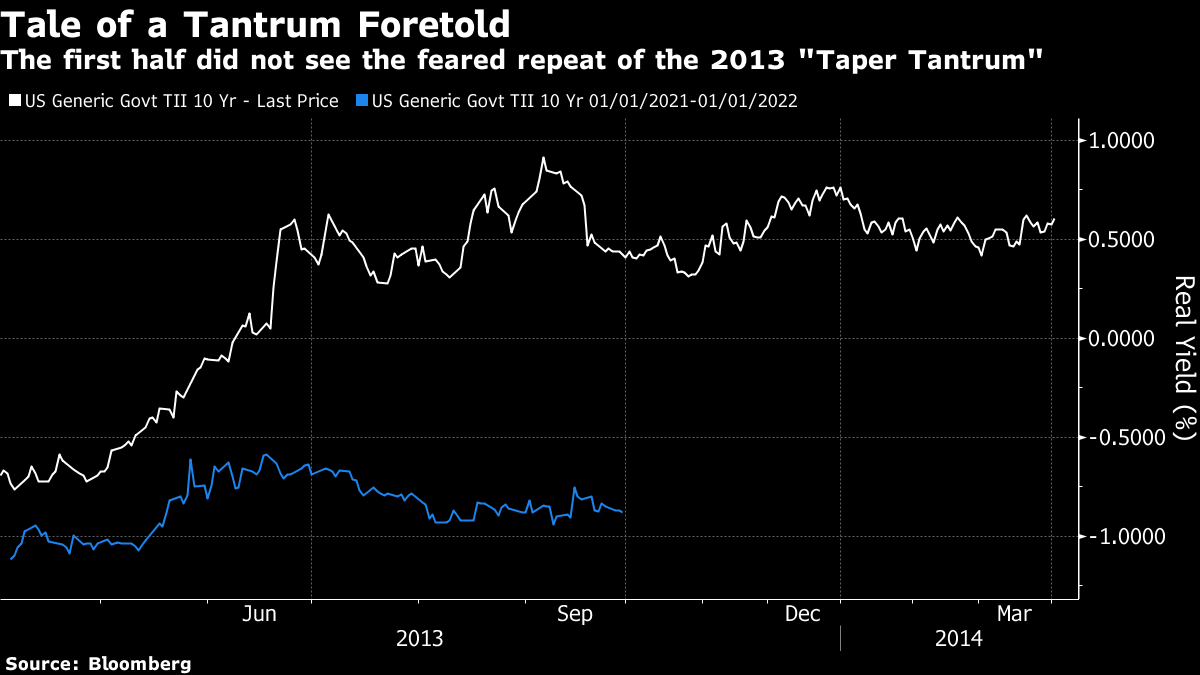 Has a tantrum been avoided, or merely postponed? The answer to that question would tell us a lot about the second half. Second, the reopening trade meant the relative decline of the huge American internet platform stocks generally known as the FANGs, and it also meant a decline for the dollar. And yet it still meant continuing dominance for the U.S. stock market. Whichever way you cut it, U.S. equities comfortably led the world over the last six months. Last year, this was because of the FANGs. This year so far, the FANGs have merely obscured a remarkable outperformance: 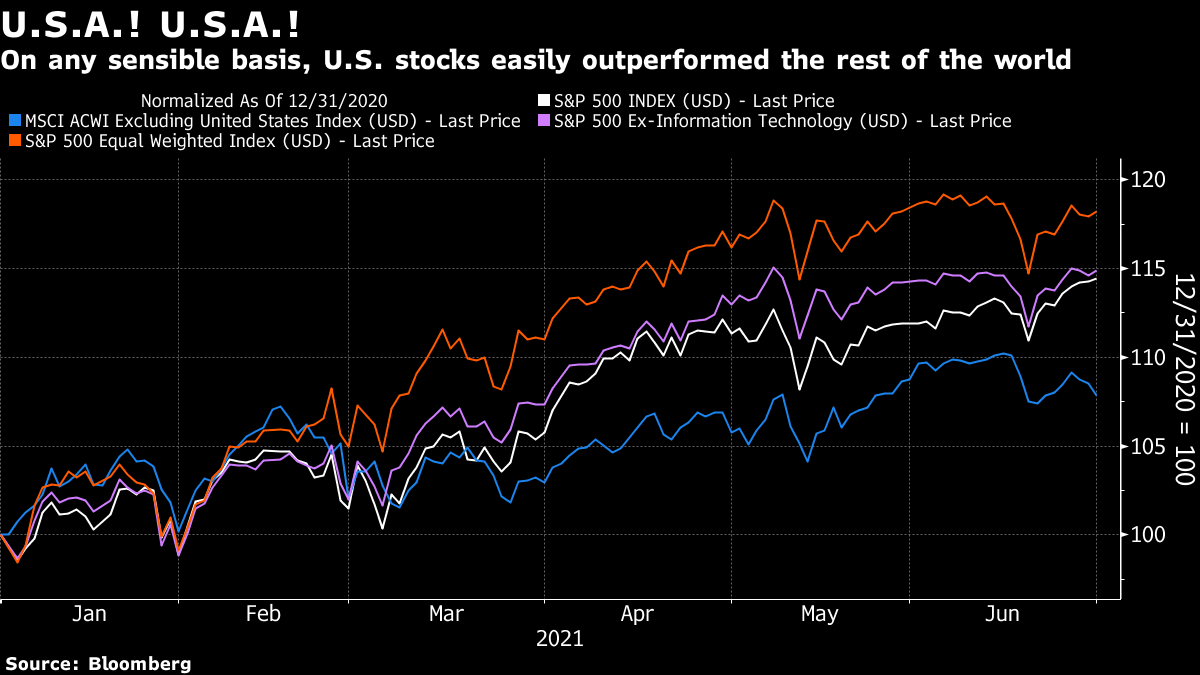 The S&P 500 has gained 14.4% compared to 7.8%, in dollar terms, for MSCI's index of the rest of the world. Exclude the information technology sector and the S&P's performance improves to 14.9%. Scrap market-cap weighting and use an equal-weighted version of the S&P 500, which drops the representation of the biggest five tech stocks from more than 21% to only 1%, and the S&P is up 18.3%. The rotation to the safety of the big internet groups benefited anyone invested in the U.S. index; but so has the subsequent rotation away from them. One obvious explanation is that the U.S. recovery from the virus this year, in line with its vaccination program, has gone much more smoothly than in most of the rest of the world. A second is that the expansionist fiscal policies of the Biden administration are much more aggressive than those of other countries, and investors like this. But it will still be fascinating to see whether such strong American performance can continue for another six months. Survival TipsAs a long weekend approaches in the U.S. I'd like to offer some improving reading for the hammock. One of the most oddly stimulating and engrossing books I've read in years is I.F. Stone's The Trial of Socrates, which is a historical investigation by a retired left-wing investigative journalist into how Socrates came to be tried and forced to drink hemlock by the enlightened democrats of ancient Athens. Somehow it made the drama of the occasion come alive, and also explained an event that I had thought I knew something about. The bottom line, which it won't spoil the book to reveal, is that Socrates' jurors were enlightened democrats, but Socrates himself was anything but. That was the problem. Monty Python was a little more accurate than I had realized. Like Bloomberg's Points of Return? Subscribe for unlimited access to trusted, data-based journalism in 120 countries around the world and gain expert analysis from exclusive daily newsletters, The Bloomberg Open and The Bloomberg Close. | 


Post a Comment