| Amid the rash of Covid-19 anniversaries, it was easy to miss that the pandemic's scariest financial moment just turned one. On March 19 last year, the 10-year Treasury completed a bizarre rebound, hitting 1.27%. On March 9, it had dropped to 0.31%, an all-time low. A gain of almost a full percentage point in barely a week, against the background of actions meant to keep yields low, qualifies as one of the weirdest moments in financial history. On the face of it, the market looked to have broken down. For some reason there had been massive selling of Treasuries at a time of extreme high risk, which would normally be exactly when investors would be expected to buy. Getting to the bottom of that accident is proving maddeningly difficult. That is the key point that comes through from a new report, Nothing but the Facts: The U.S. Treasury Market During the COVID-19 Crisis, published by the bipartisan Committee on Capital Market Regulation, or CCMR. It comes to the disturbing conclusion that there isn't enough information about this vital market for us to work out with any certainty who sold, or why. That makes it harder to know how to stop another such accident in future. This is the CCMR's depiction of what happened. The Federal Reserve was already intervening, even as yields plummeted, and then started making massive extra purchases of Treasury bonds as yields turned around and started to rise. Three separate fresh interventions weren't enough to bring them back down again. Bond market volatility peaked on March 19, at a level even higher than the post-Lehman Brothers crisis in 2008. Then, with daily Fed bond purchases of about $70 billion, the Treasury market steadily found a level. 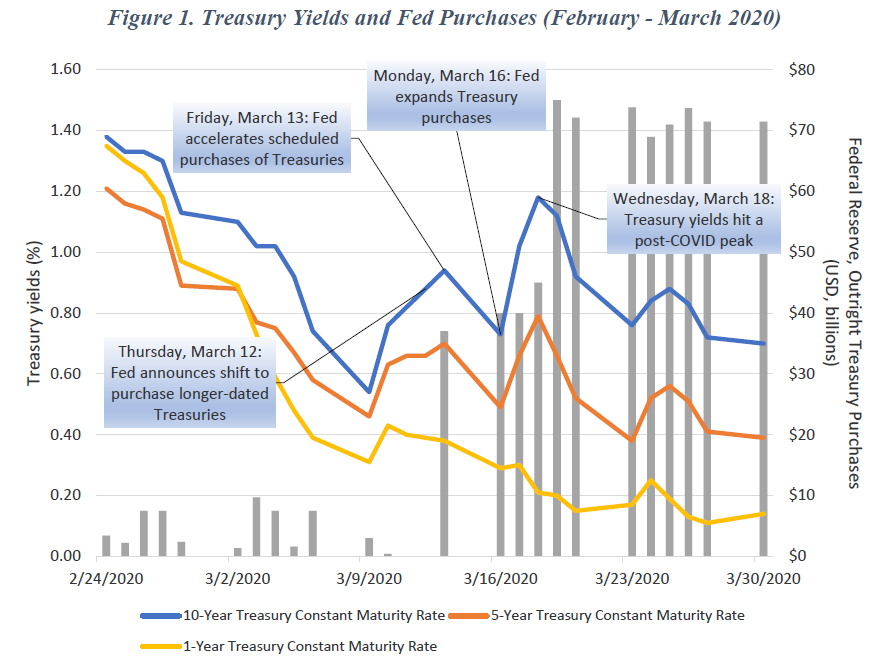 Since then, yields have returned in more orderly fashion to their levels before the pandemic, while the Fed's daily purchases have dropped from $75 billion to a still very high $3 billion. With a year's perspective, what happened last March seems even more of an aberration: 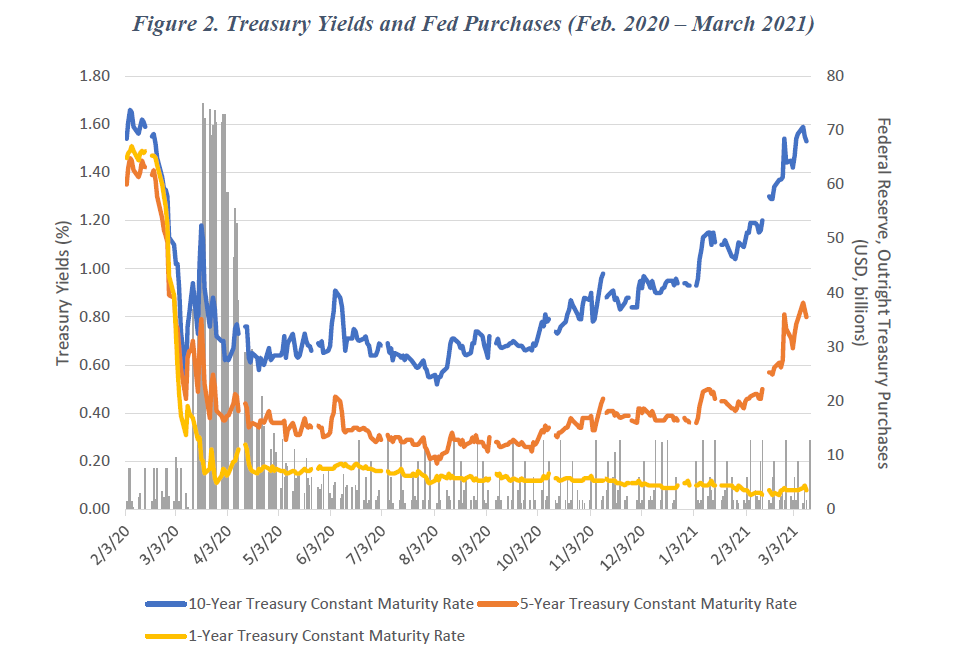 How exactly did the market break? The question involves delving into the opaque structure of Treasuries trading, most of which is over the counter. The market is mainly dominated by broker-dealers (big banks), but with an increasing share taken by principal trading firms, which often use algorithms and carry little inventory overnight. 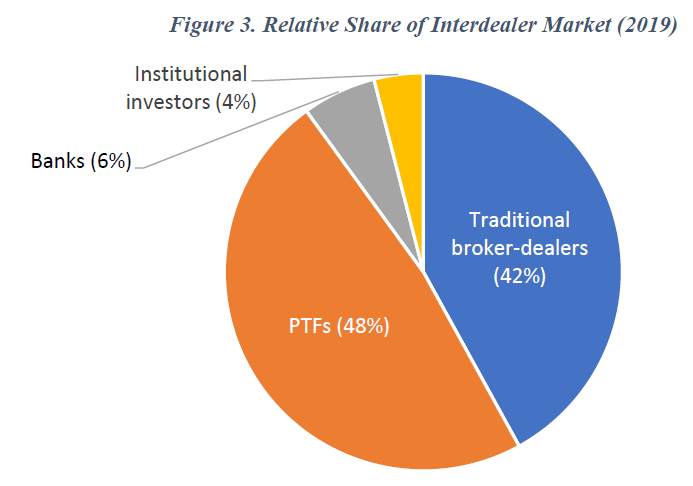 Broker-dealers are executing mostly on behalf of clients, and have to register with the Securities and Exchange Commission. Principal trading firms must also register if they offer to execute trades for others. In practice, principal firms tend to dominate automated trading, while broker-dealers account for the great bulk of voice and manual orders. Different entities have different reporting requirements, while trading venues have varying policies for disclosing who is active. The fracturing and diversification of the market is in many ways healthy, as it introduces competition and provides investors with a chance to minimize costs. But the effect has been to make an already complicated market opaque. The CCMR's conclusion is that regulators don't demand enough information for anyone to know who sold. As the CCMR says in its report: neither the trade reporting obligations for broker-dealers nor the additional reporting obligations for certain trading venues provide regulators with information regarding the identity of PTFs that are not
FINRA members, banking entities and investors that trade on manual interdealer platforms and in the dealer-to-client market. Such investors include mutual funds, hedge funds, pension funds, insurers, foreign central banks and sovereign wealth funds, among others. The lack of such information
is a critical missing piece in understanding the volatility experienced in the cash Treasury market during March 2020.
What information does exist helps to suggest likely sellers, but it isn't produced frequently enough to deduce exactly who created the intense selling pressure. The Fed's quarterly data show that during the first quarter there were big falls in Treasury holdings by foreign investors ($287 billion), open-end mutual funds ($236 billion) and the domestic household and nonprofit sector ($170 billion). But the categories are broad, and it's always possible that these groups had done most of their selling earlier in the quarter. Meanwhile, the Treasury Department publishes monthly data on rises and falls in holdings by foreigners. Last March saw big reductions by residents of Saudi Arabia ($25 billion), Brazil ($21.5 billion) and the euro zone ($44 billion). It also has transaction data that show large net sales by residents of the Cayman Islands ($117.9 billion) and the U.K. ($41.5 billion). But again, the data aren't granular enough to tell us which exact operators with addresses in the Caymans bailed out. The CCMR suggests that regulators stay their hands when it comes to making potential radical reforms until they have better information. This might strike some cynics as pleading by Wall Street to avoid more regulation. But the CCMR makes clear that the greatest need is to fix the disclosure regime, which has plainly not kept up. That does seem like it should be a priority. Inflation Breakevens and OilNow, for another paradox. Inflation breakevens — the forecast that can be derived from the difference between the yields on inflation-linked and fixed bonds of a given maturity — are at their highest since 2013. That is quite something when the world is still in the grip of a pandemic. 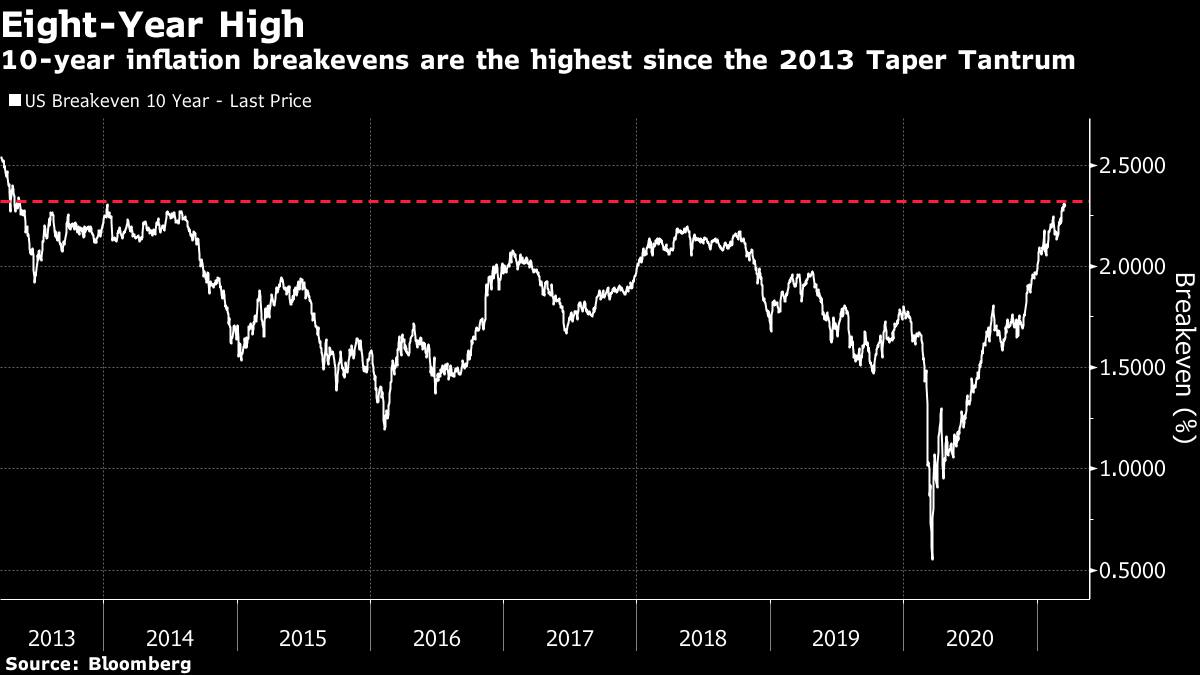 Part of this may be the well-known flaw in the Treasury inflation-protected securities, or TIPS, market, which sees 10-year breakevens move in the same direction as the oil price. This is caused by the widespread use of TIPS for hedging moves in oil futures. From 2014 to the end of 2019, the alignment is clear: 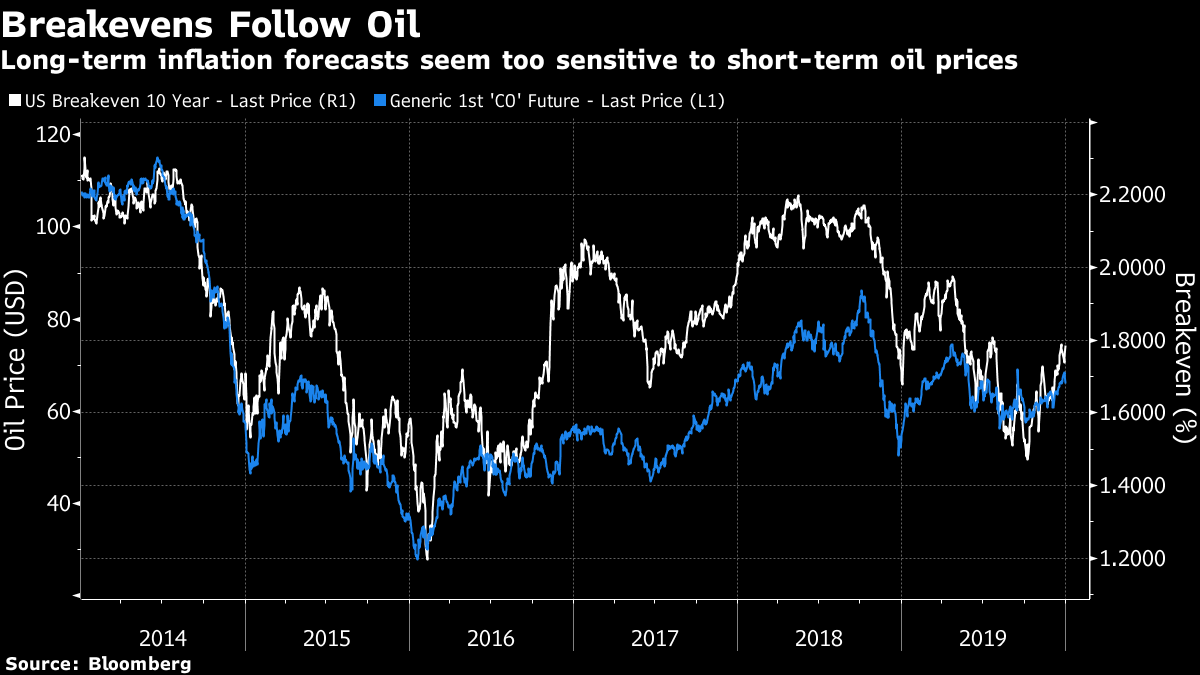 Dhaval Joshi, European strategist at BCA Research Inc., suggests this is a major market inefficiency, as oil prices and inflation forecasts should be negatively rather than positively correlated. He shows that moves in the oil price do tend to have an impact on realized inflation over the next decade, but not in the direction we might expect. Higher oil prices mean lower subsequent inflation, and vice versa: 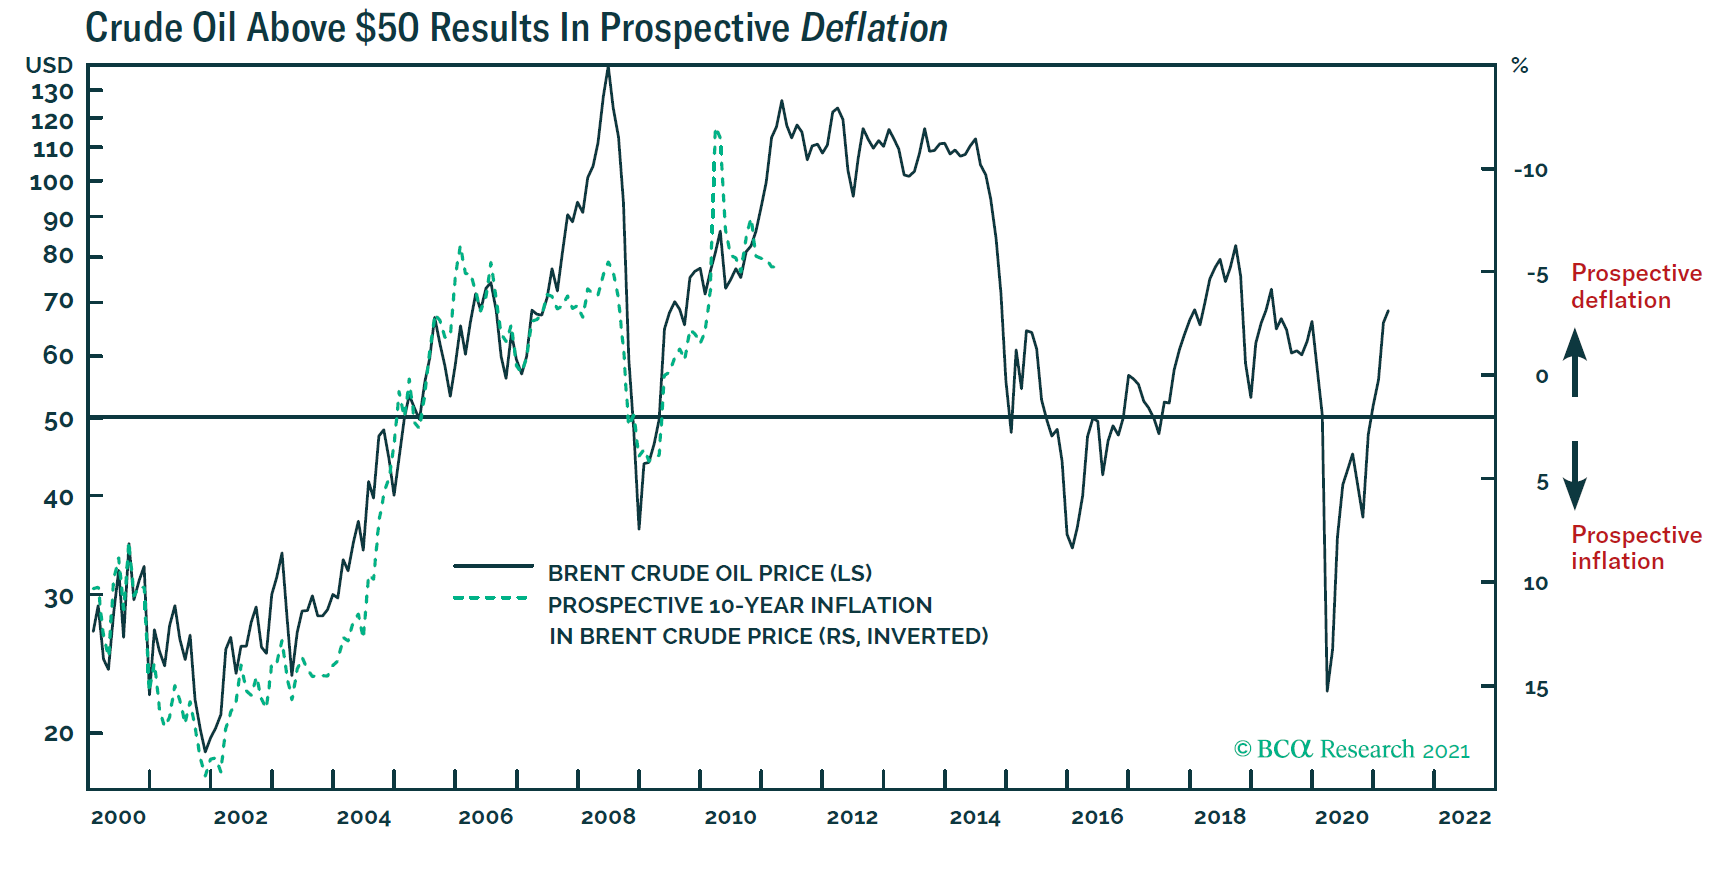 There is some intuition for this. First, higher oil prices act like a tax increase, and tend to dampen consumption. They should therefore be treated as similar to a mild tightening in fiscal policy. Beyond that, there is the simple logic that when the oil price starts high, all else equal, the odds increase that it will be lower 10 years hence. This in itself will bring down the rate of inflation. Joshi suggests a simple trading strategy that has worked over the last 20 years. When oil is above $50 (as now), that implies investors are overestimating future inflation, so you should get out of TIPS and buy conventional T-bonds instead. The reverse holds if the price goes below $50: 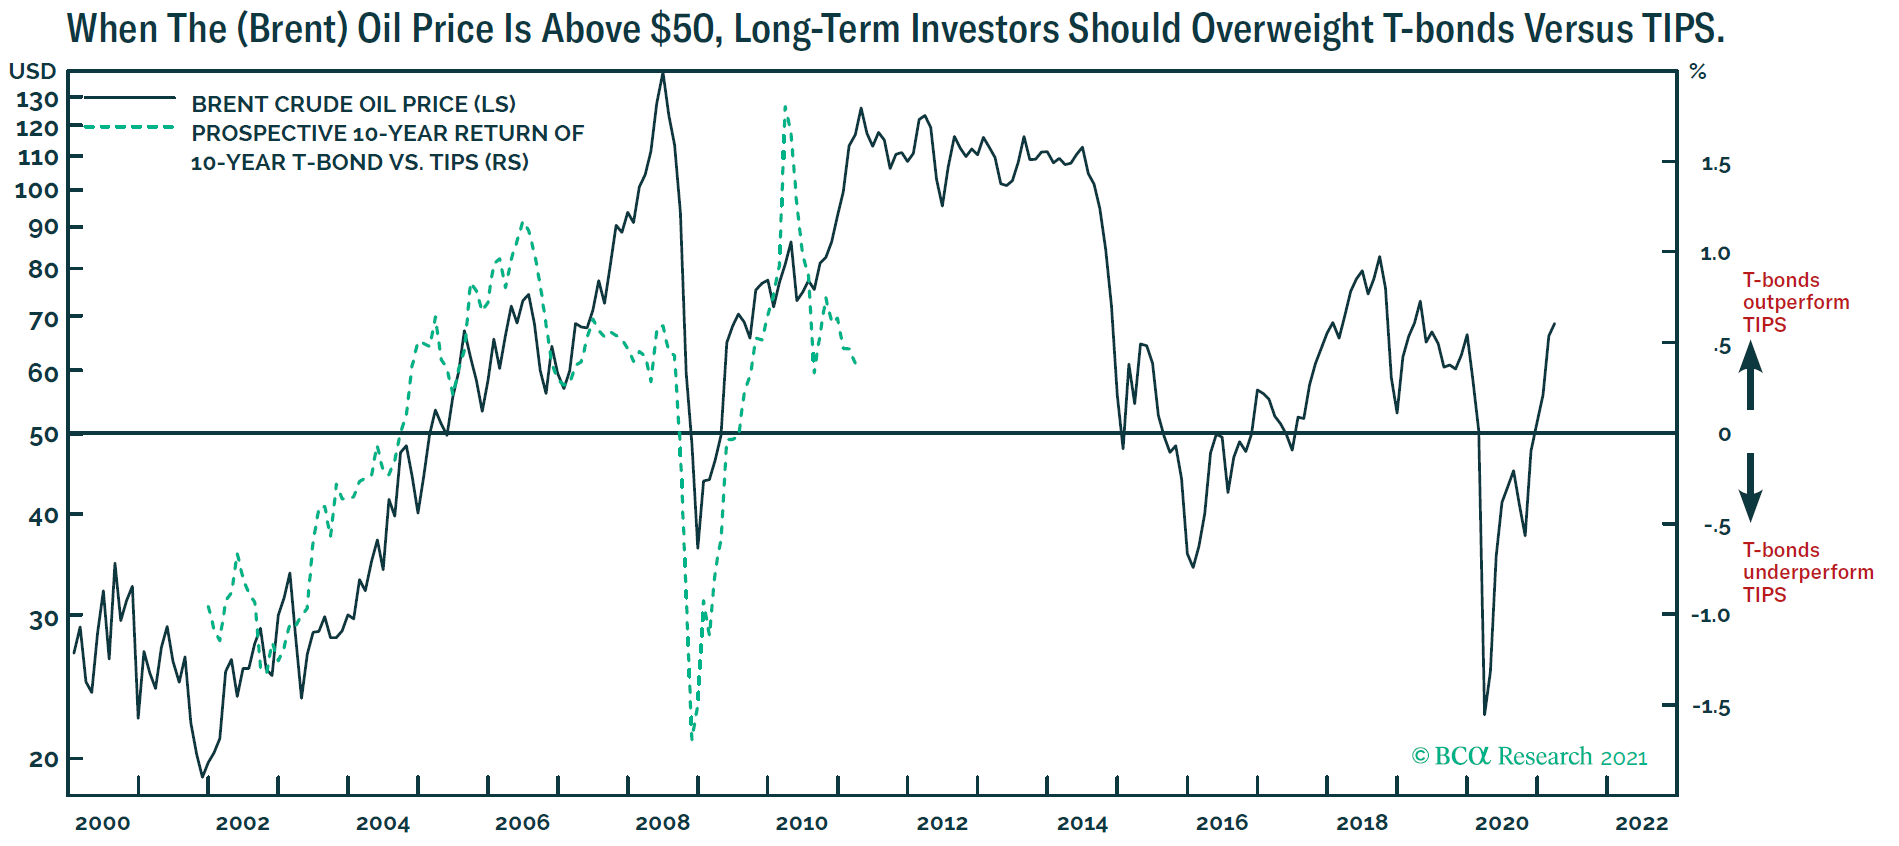 Following this rule would have led you to buy TIPS when the oil price tanked a year ago, which would have worked out very well. And it would cause you now to buy Treasury bonds rather than TIPS. The bottom line is that bond market inflation expectations are too high. Inflation, Demographics and JapanOne of the most interesting and persuasive arguments that a shift toward secular inflation is under way, which we highlighted in the last Bloomberg book club, is the idea of a great demographic reversal. In their eponymous book, Charles Goodhart and Manoj Pradhan argued that the shift to a grayer population will lead to more inflation, as old people spend rather than save, while a shrinking number of workers have greater negotiating power to push up wages. The forthcoming change in China's demographics, following years when its growing workforce helped keep prices low in the developed world, is also part of the argument for secular lower inflation Gerard Minack, who describes his former colleague Pradhan as a "mate," has now sent me the strongest attempt I have seen to date to refute the Goodhart and Pradhan argument. First, Minack makes the point that the price of goods compared to services had been tumbling in the U.S. for decades before the entry of China into the world economy in a big way at the beginning of this century. Improved productivity and automation might help explain this. The following chart shows that China's accession to the World Trade Organization simply accelerated the trend. China's entry, in short, isn't as big a deal for inflation as some think it is: 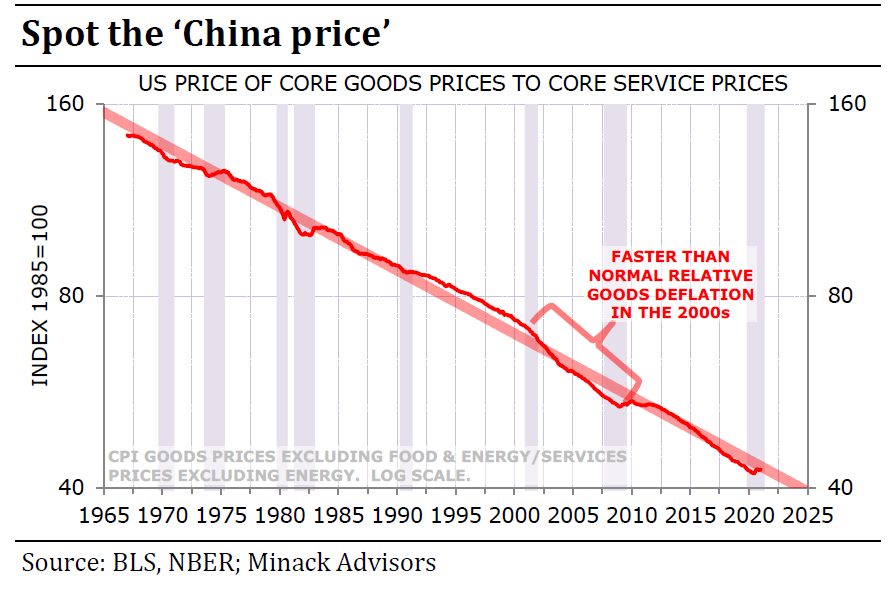 Now we come to Japan. A key Goodhart/Pradhan argument is that a smaller labor force, as a proportion of the population, will lead to greater negotiating power and more wage inflation. But as Minack shows, declines in the workforce have been matched by declines in pay, while Japanese workers have gained a better deal for themselves, contrary to theory, when their numbers have risen: 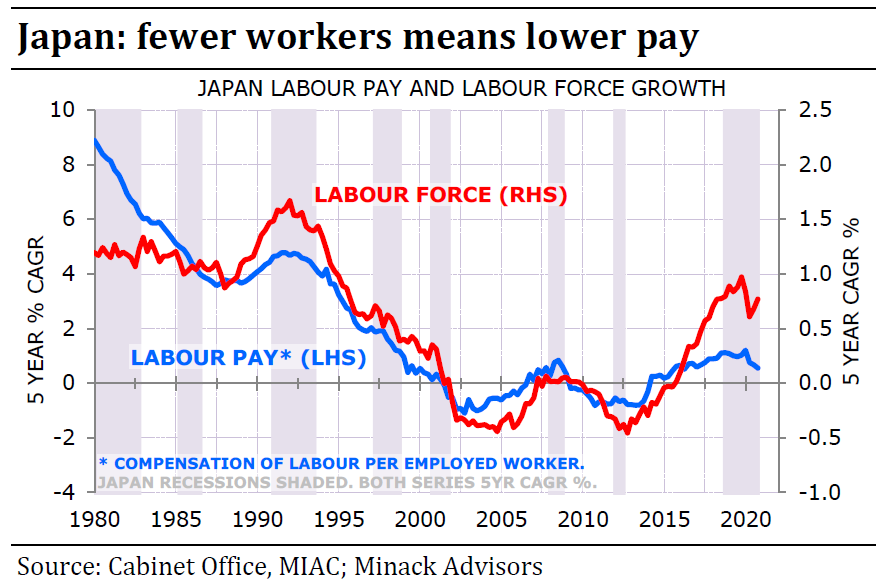 Meanwhile, Minack tries to move the spotlight from savings to investment. A population with more old people will save less, and therefore spend more; therein lies the argument for inflation. But Minack argues that an older population with more retirees will also invest less, and that could be a more important driver of inflation than spending. If we look at investment's share of GDP compared with fluctuations in Japanese labor force growth, the relationship is clear: 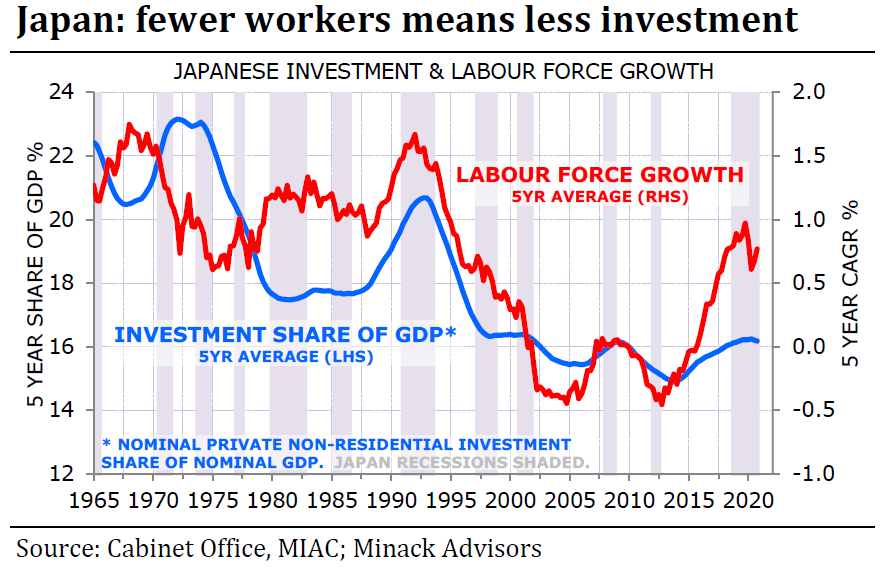 Repeating the same exercise for the U.S. reveals if anything a tighter relationship. So the Minack argument is that a nation with more retirees will be one that makes even less attempt to invest for growth, and thus stays in the same horrible slow-growth conditions of the last decade: 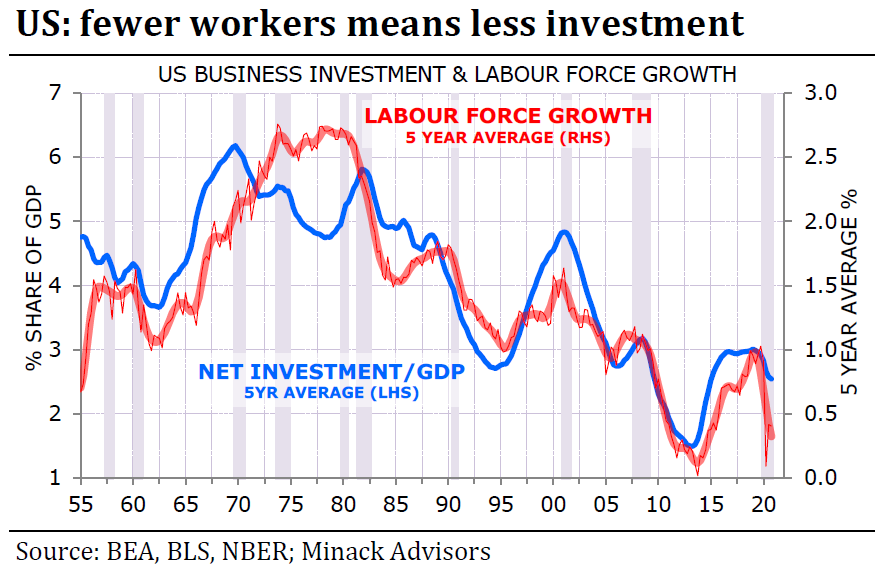 Finally, Minack shares a fascinating chart build with data from the Organization for Economic Cooperation and Development, which matches average core inflation for the last decade on one scale against the population over 65 on the other. Japan has a very elderly population and minimal inflation. South Africa and Mexico, much younger nations, had the highest inflation in the OECD (although Mexico's was still barely over 3%). Keeping these two outliers in the sample, the correlation between trend inflation and elderly population is a respectable 59%; without them, it drops to 25% among the sample of mostly well developed nations that remain. The basic point is that to date ageing has been associated with lower, not higher inflation: 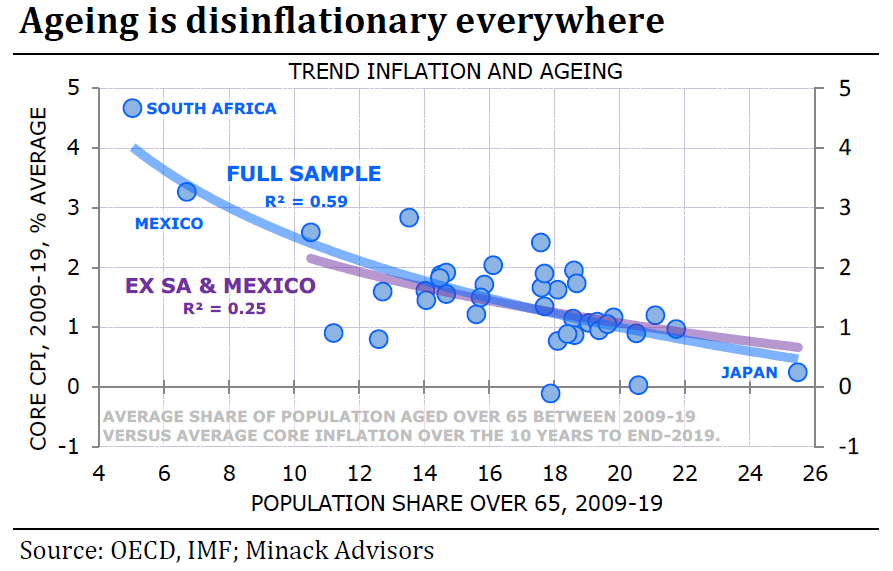 Something tells me this won't be the end of the inflation debate. All contributions on the subject would be appreciated. Survival TipsPerhaps the best survival tip I can offer is to join a book club. It looks like "normal" life still isn't that close, and book clubs have helped get the family through the last 12 months. They offer a great chance for discussion, along with moral pressure to complete a book. You know you'll feel better if you do. That brings me to the Bloomberg book club, as I've had various people asking how to join. The idea is that you don't need to join - you just need to read the book. The initial concept was to try to do Oprah's book club for a Bloomberg audience. I found a clip of Oprah introducing the club 25 years ago, which goes through the idea. In Oprah's case, she went on to become one of the most influential figures in the world of publishing. In our case, we're just experimenting with building community. So: the current selection is Reminiscences of a Stock Operator by Edwin Lefevre, the classic written almost a century ago about speculator Jesse Livermore. You can read it like a beach novel narrated by a lovable rogue — it just so happens to be about the technicalities of trading in the market. On Wednesday at 11 a.m. New York time, we'll hold a live blog discussion about the book on the terminal with my colleagues Larry Tabb and Kriti Gupta, and Jamie Catherwood of the Investor Amnesia blog. If you don't have access to the terminal, you can still send in thoughts, comments and questions to the book club email; authersnotes@bloomberg.net. A full transcript will be posted on the internet later on Wednesday. It won't be quite as much fun as an Oprah show, but I hope it will be worth your time. Have a good week. Like Bloomberg's Points of Return? Subscribe for unlimited access to trusted, data-based journalism in 120 countries around the world and gain expert analysis from exclusive daily newsletters, The Bloomberg Open and The Bloomberg Close. | 


Post a Comment