| To get John Authers' newsletter delivered directly to your inbox, sign up here. Rotating to the Small GuysThe little guys are back. After another rather weird day of trading, even the outsize gain for Tesla Inc. that followed news of its accession to the S&P 500 couldn't stop a down day for U.S. stocks. But beneath the surface, smaller companies are stirring. This shouldn't be surprising. Academics have long said there is a "size effect," in which small caps can be expected to outperform in the long term, all else equal. Over time, U.S. stocks have behaved roughly in line with that. The following chart shows the Value Line index, which is an arithmetic average of each day's price moves of all U.S. stocks (thus giving more weight to smaller companies, because there are more of them) relative to the Wilshire 5000 Total Market index, which is market-cap-weighted. Since inception in 1988, the average stock beats the market: 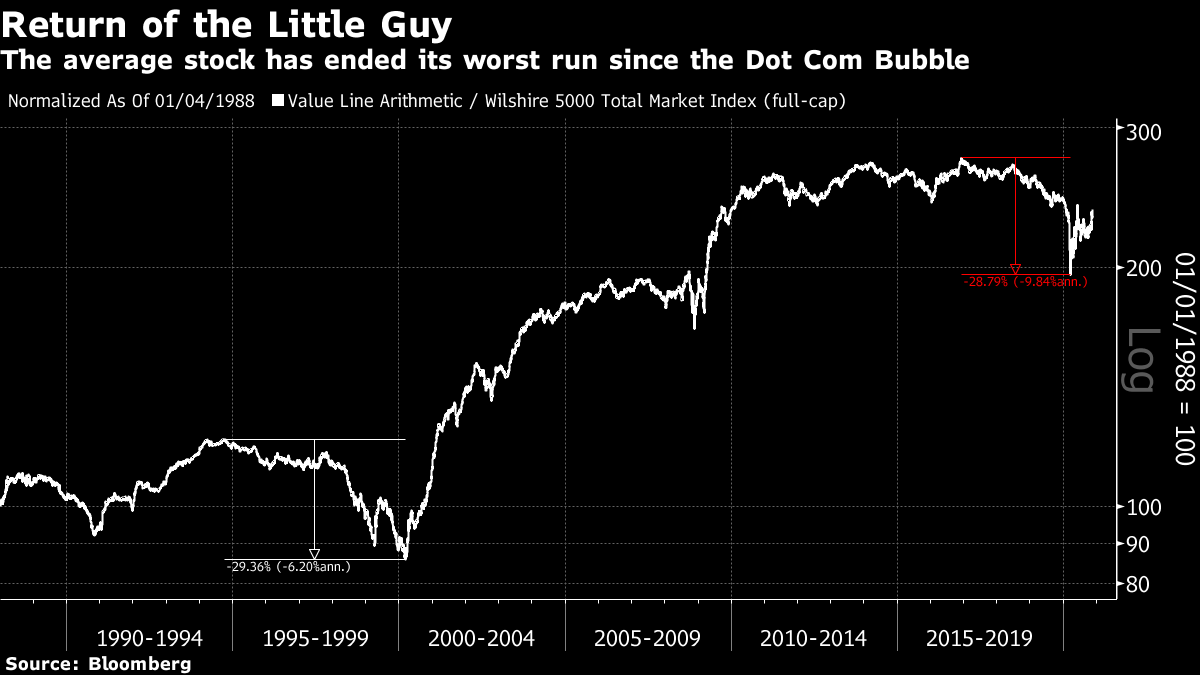 There have been two great interruptions to the trend, and they look very similar to each other when viewed on a log scale. In the late 1990s, the average stock underperformed by 29.4% amid the excitement over dotcom companies. And in the last few years, the average stock lagged the market by 28.8%, over a period that culminated in Covid-19. One involved a huge exogenous shock and the other didn't. Viewed as market phenomena, though, that FANG frenzy of the last few years looks very much like the dotcom bubble. The average stock is still lagging the market for the year. But this month has seen the Value Line index at last break out of a range that had held since June. Suddenly, the average stock is up 10% for the year. The only relevant precedent suggests that there could be a lot more outperformance for smaller companies ahead of us: 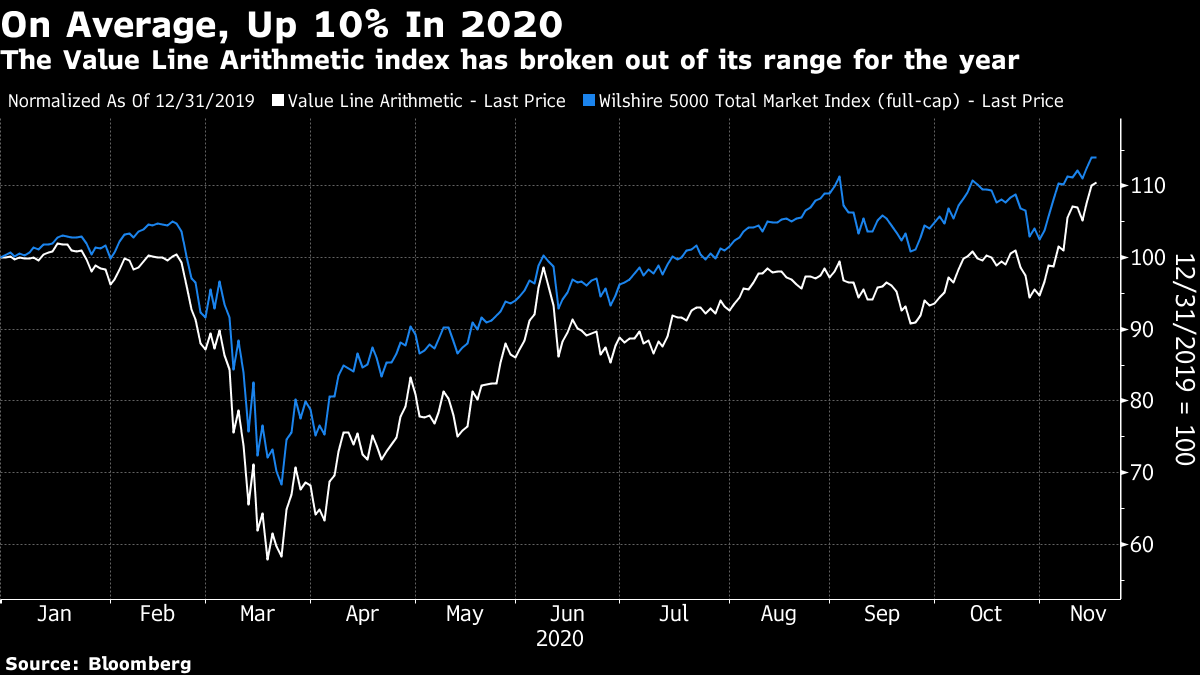 Outside the U.S., without the FANG internet platforms, the picture is clearer. Smaller companies didn't lag in the first place, and now they are ahead for the year. The following chart compares the small-cap version of the MSCI EAFE (Europe, Australasia and Far East) developed markets index, to the large-cap version for the year: 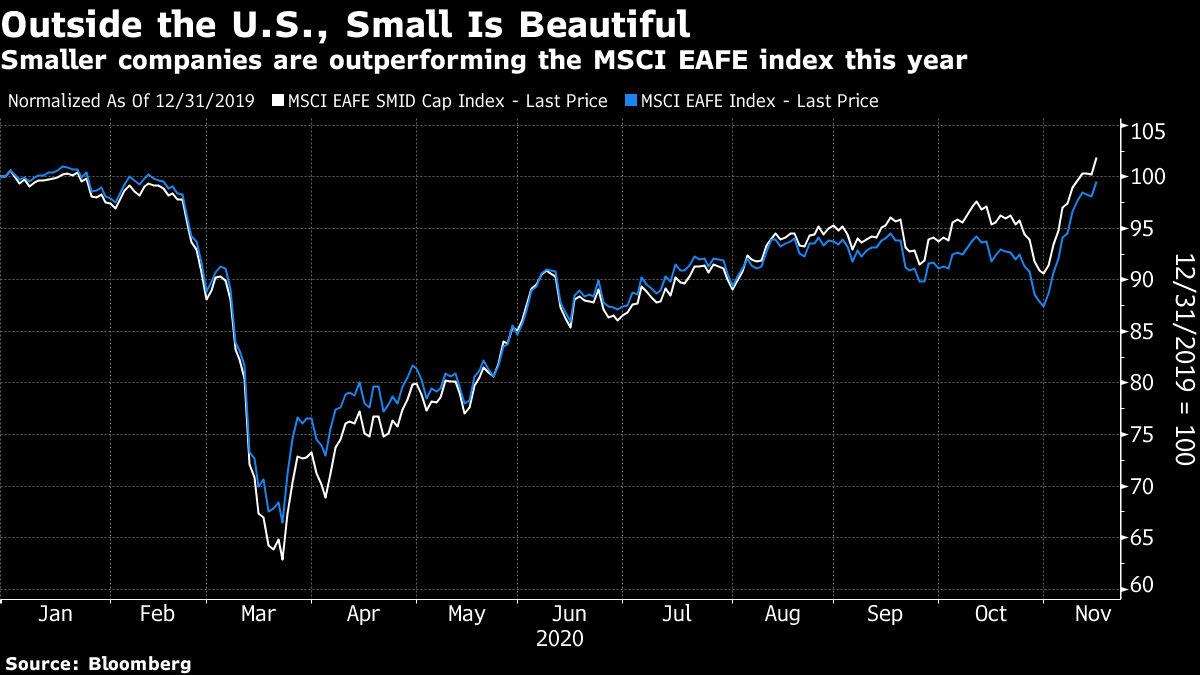 The extreme defensive crouch in which markets have been positioned all year is slowly being abandoned, and this allows life to return to smaller stocks, globally. Rotating Away From the U.S.For another argument in favor of a steady rotation away from the market leaders, we can also try technical analysis. These arguments also suggest we are on the verge of a rotation out of the U.S. In the following chart, produced by Chris Watling of Longview Economics in London, the red line shows the distance between the S&P 500 and its 200-day moving average, measured in standard deviations. It is now two standard deviations above the mean, for the first time since May 1999: 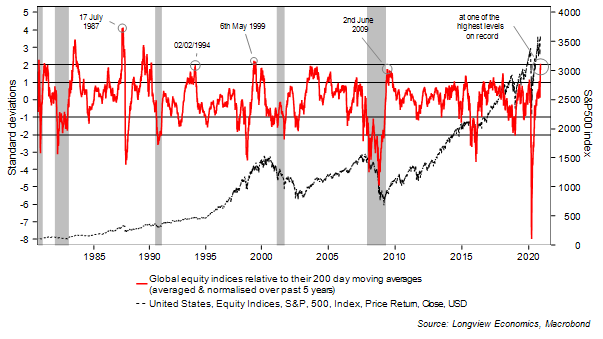 When markets move this far ahead of themselves. they have generally discounted an awful lot of good news in advance (as now), and don't go much further. There is also an elevated risk of a major fall. The recent high for this measure came in late January of 2018, shortly before the market accident now widely referred to as "Volmageddon," when bets on low volatility imploded. In the wake of that incident, global indexes (in red) staged a major retreat, while the S&P 500 sold off swiftly, and then moved sideways before suffering the end-of-year selloff now generally nicknamed the "Christmas Eve Massacre": 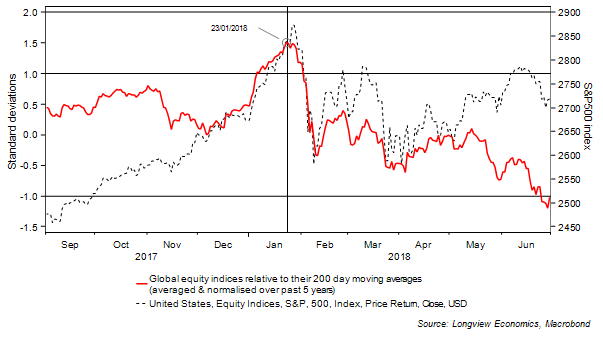 The 200-day moving averages suggest an interesting moment has been reached in the long-running tendency for the U.S. to outperform the rest of the world. Volmageddon and Christmas Eve in 2018, circled in the chart, proved to be great entry points to buy America and short everything else. The S&P relative to FTSE's index for the rest of the world has been ahead of its 200-day moving average constantly since Christmas 2018 — until now: 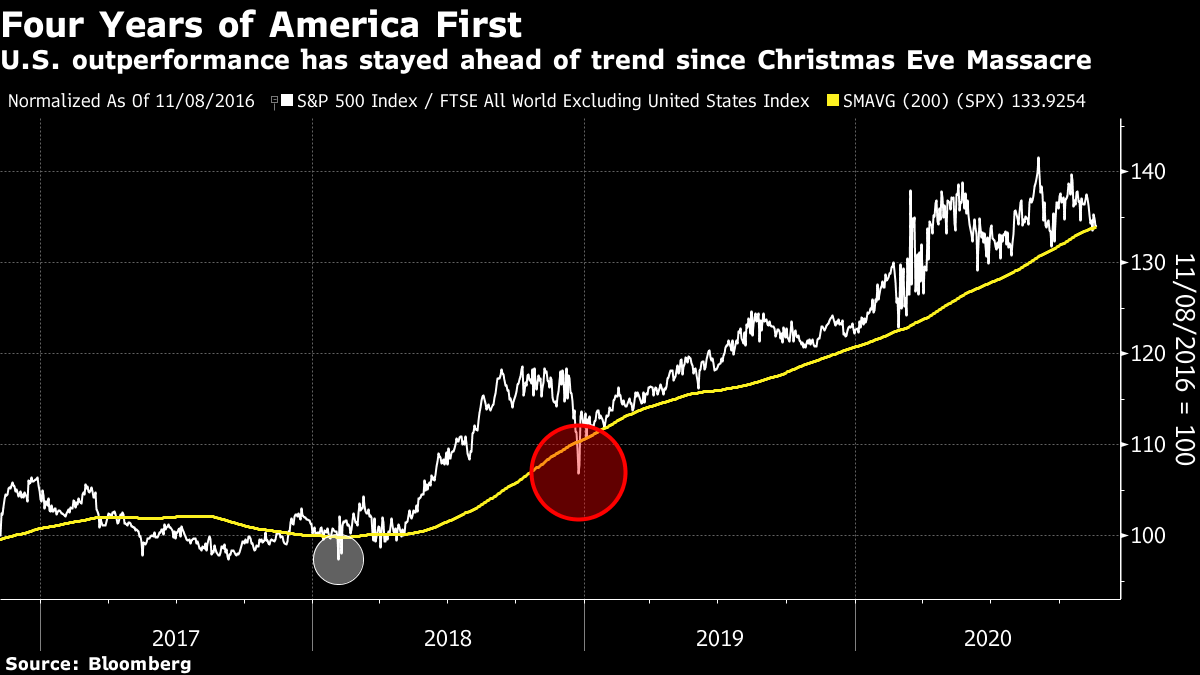 A retreat from American outperformance can be explained in terms of risk aversion, which had been growing because of the trade war long before the pandemic brought it to a peak. Risk-averse international investors found safety in FANG stocks, whose appeal should now start to grow a little duller. Meanwhile, the dollar is reliably treated as a haven, which explains why Bloomberg's broad dollar index spiked as the pandemic took hold. It is now at its lowest since early 2018. The dollar was unusually steady during the Trump years. Should its decline gather momentum, that would contribute to outperformance by non-U.S. markets: 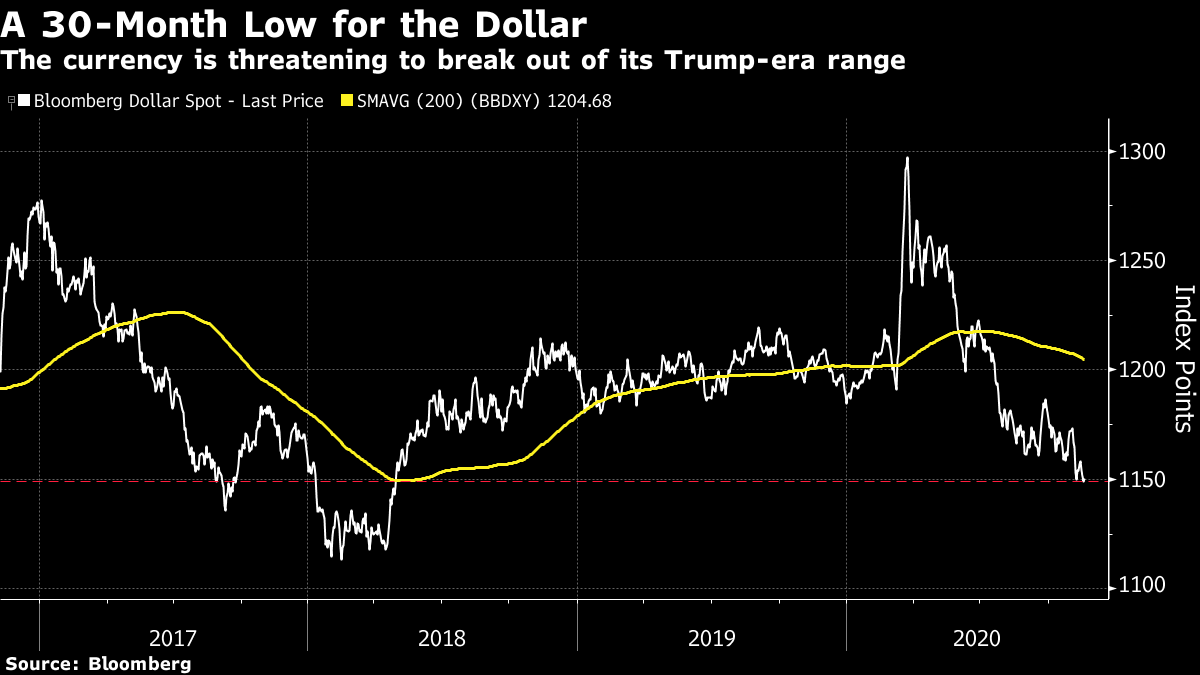 For those who share my discomfort with relying on technical measures, there is another reason to expect performance to move away from the U.S., which is that China appears to have its economic engine back in good shape. In the last few months, MSCI's index of the 100 MSCI World member stocks with the greatest exposure to China has been rallying impressively. It now has roughly twice the returns for the year of the MSCI World index as a whole: 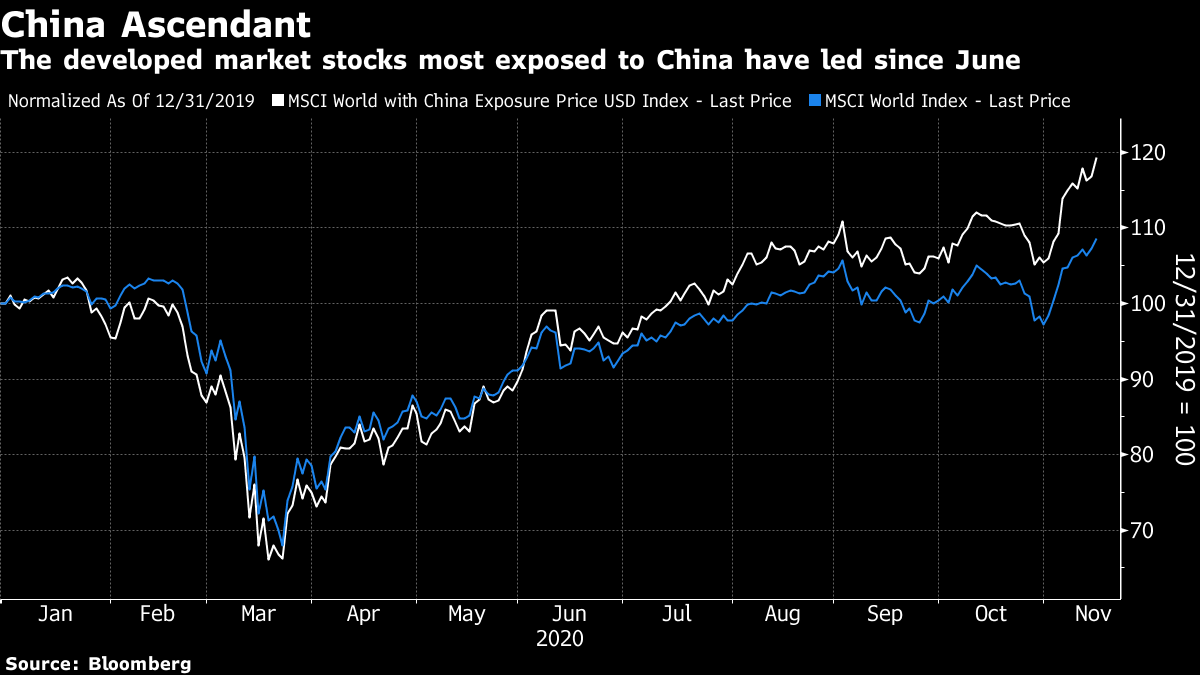 The last time China was viewed firmly as the center of world growth came in the years after its accession to the World Trade Organization, in December 2001. Over the seven years from that point until the near-collapse of the global financial system in 2008, the U.S. endured persistent underperformance, with the S&P 500 lagging the rest of the world index by some 43%. At that point, the rest-of-world gauge didn't even include mainland Chinese stocks. Strategists are now well into the season for unveiling predictions for next year. They can often be wrong; last year, I reported that "year-ahead" conferences were dominated by the specter of Massachusetts Senator Elizabeth Warren, who seemed to have a good chance of being the next U.S. president. Nothing makes a prolonged period of U.S. underperformance inevitable. But look through these charts and you can see that there are reasons why yet another historic high for U.S. stocks is being greeted by widespread calls from strategists to diversify away from the recent leaders, and from the U.S. altogether. Land of the Rising SunJapan has enjoyed the quiet life of late. Its economy and markets command none of the attention that they used to enjoy. There's a simple reason for that, which is that the markets still haven't recovered from the bursting of their 1980s bubble, which was based on surging real estate values and the phenomenal success of Japanese exporters. The Topix index, the best broad stock market gauge, is still below its 1989 peak. Over the same period, the S&P 500 has grown ninefold: 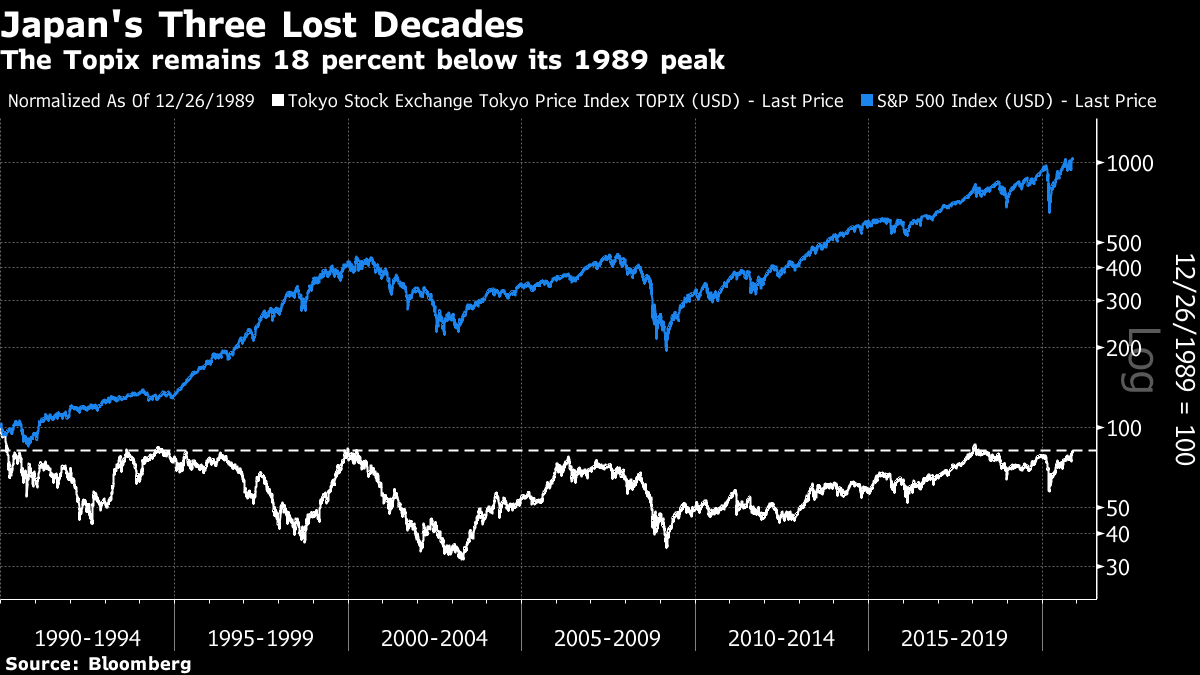 Is it time to pay Japan a little more heed? As the chart shows, the Topix is close to its highest in decades, a level already touched by the rival Nikkei 225, which is price-weighted. And it hasn't got there on the back of excessive valuations. In fact, it is as cheap as it has ever been relative to the S&P 500, barring only the top 12 months of the dotcom bubble, more than 20 years ago. The chart shows the spread between the S&P and Topix price-book multiples. The U.S. has traded at a premium since 1993, but this is only the second time that premium has reached above 2.5 times book value. 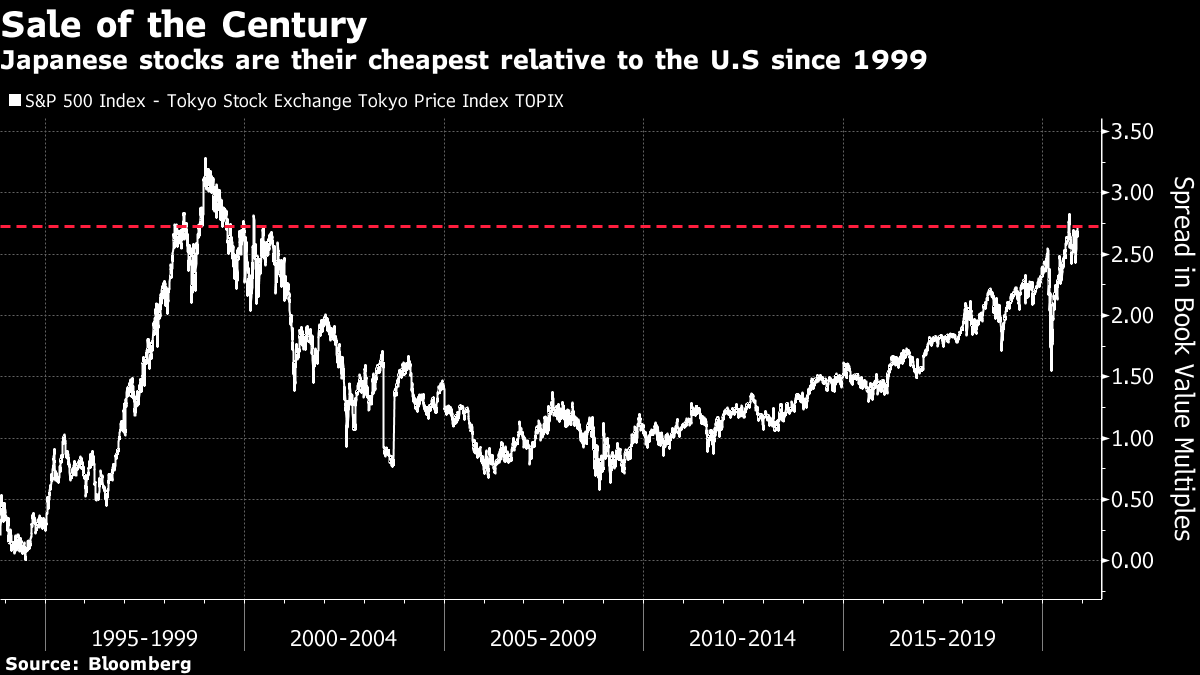 Japan is often dismissed as a value trap, with some justice. Nevertheless, it's interesting to see how well you would have done by buying the Topix and shorting the S&P on Jan. 8, 1999, the day the premium reached its historic peak. The Topix enjoyed sharply better returns, and the trade remained positive almost all of the time until 2011: 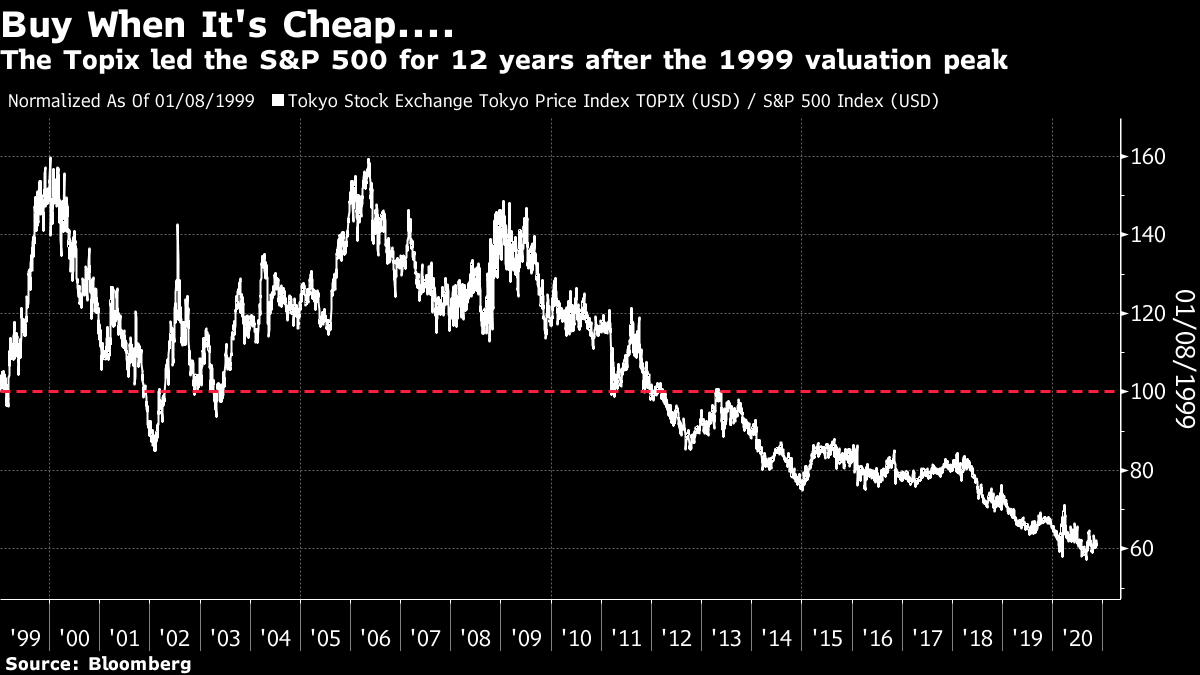 Since then, the Topix has steadily and seriously underperformed in dollars, in part because the "Abenomics" program adopted by incoming premier Shinzo Abe in late 2012 involved aggressively weakening the yen. Still, the evidence is that when Japan has looked this historically cheap, it has been a good idea to buy Japanese stocks. Add to this there are some specific reasons for optimism. Japan managed a seamless transfer from Abe to his preferred successor Yoshihide Suga in September. And while we don't yet know how severe the economic "scarring" from Covid-19 will be, it's a fair bet that Japan's will be less serious than those of any other major economy. In this league table of G-20 countries compiled by Deutsche Bank AG, Japan's record looks excellent: 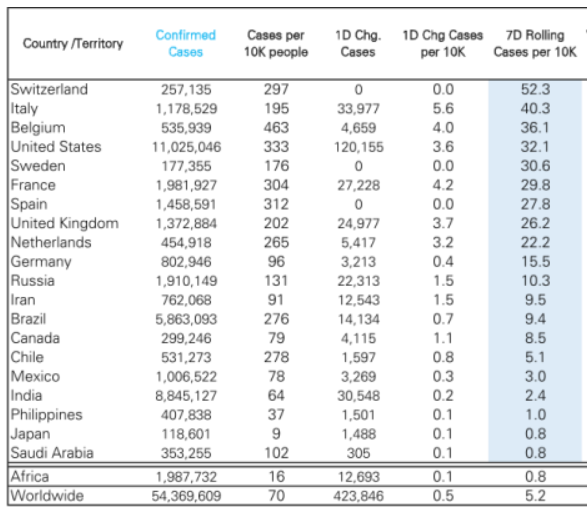 If anyone wants a catalyst, the chances now seem much stronger that Tokyo will be hosting an Olympiad before 2021 is out. Then there is the fact that Japan seems less at risk from serious political unrest than many other leading developed nations, remaining relatively wealthy and egalitarian despite its long slump. The following is from a piece for the Japan Times by Jesper Koll, head of WisdomTree Investments Inc.'s business in Japan and an inveterate bull on the country: Creating and sustaining a stable society is one of the fundamental goals of economic policymaking. For this, an economy must both grow and distribute the spoils of wealth creation in a fair and equitable way. So what's the score? How wealthy are the people and how is that wealth distributed? At the end of last year, the median net financial wealth — all financial assets minus liabilities — for households in Japan stood at $104,000. In the United States, it was $62,000. Clear-speak: The average Japanese is actually about 40% richer than the average American. So Japan clearly beats America on the absolute amount of wealth owned by the average household. But what about the distribution? At the bottom end in Japan, approximately 5.5% own less than $10,000 worth of net financial assets. In America, that's true for 28.4%. There is no denying that Japan does have an underbelly of poor people, but compared to America, relatively few are truly left behind financially. If at all, it should be a national embarrassment that almost 1 in 3 Americans does not have $10,000 to their name, particularly since the U.S. stock market keeps surging to new historic highs.
Viewed through the lens of the stock market, and through total rather than per capita GDP, it is easy to make Japan look like a disaster. It isn't. And like other countries, its Covid-era policies have resulted in citizens holding a large supply of cash that is now ready to be spent, as shown by this chart from Societe Generale SA: 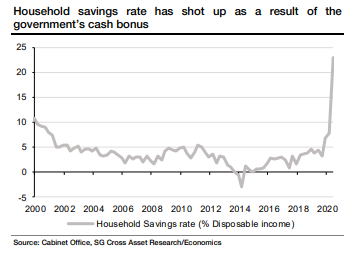 Japan has disappointed investors countless times over the last 30 years. But if there were a time for some Japanese outperformance, it might be about now. Survival TipsSnail mail, bringing with it something tangible, still has a lot to recommend it. For obvious reasons, my family won't be heading home to England for Christmas this year. This means my parents and children will have to go more than a full year without seeing each other, which is difficult for all concerned. Given the circumstances, there was a lot to be said for the huge parcel that arrived today from England, including such delights as face masks made out of material taken from beloved shirts I stopped wearing more than 40 years ago, chutney, jam, Marmite (of course), any number of things of intense delight to the kids, and a Christmas pudding. (You don't have to celebrate Christmas to enjoy a thoroughly alcoholic Christmas pudding.) The children are used to receiving parcels, of course. But they generally have "Amazon" written on the side. Receiving anything physical by mail from anyone they actually care about (Jeff Bezos doesn't count), turns out to be extremely exciting. In a period of forced separation, it may be time to give parcel delivery services even more business. (And, by the way, thanks Mum.) Like Bloomberg's Points of Return? Subscribe for unlimited access to trusted, data-based journalism in 120 countries around the world and gain expert analysis from exclusive daily newsletters, The Bloomberg Open and The Bloomberg Close. | 


Post a Comment