| There is plenty of talk about a bubble in some new companies with untried business models. Think, particularly, of Tesla Inc. But is there something equally unsustainable going on in a commodity whose virtues have been known for millennia, and remain unchanged? Spot gold rose to a record of $1,923.2 an ounce in Asian trading Monday: 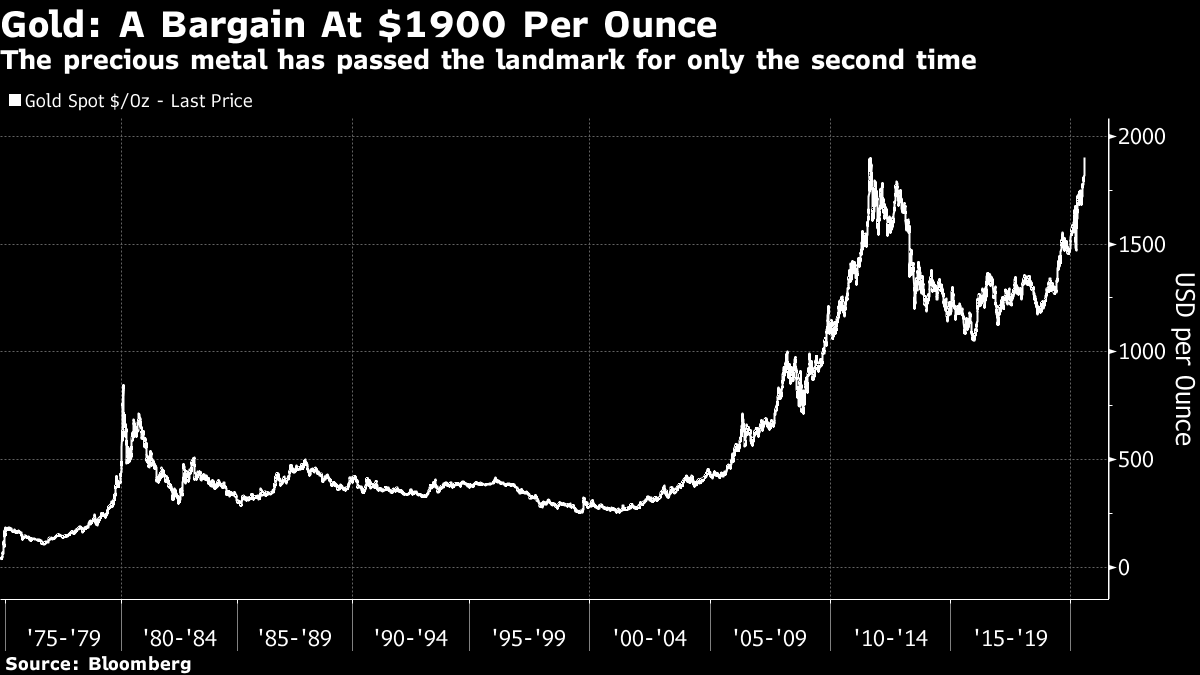 This is the third major spike in the modern era since the Bretton Woods tie of the dollar to gold was abandoned in 1971. Once inflation is accounted for, gold remains below the last all-time high of 2011, and far below the historic summit of 1980, in the wake of the second oil price shock, when investors assumed that endemic inflation would continue forever: 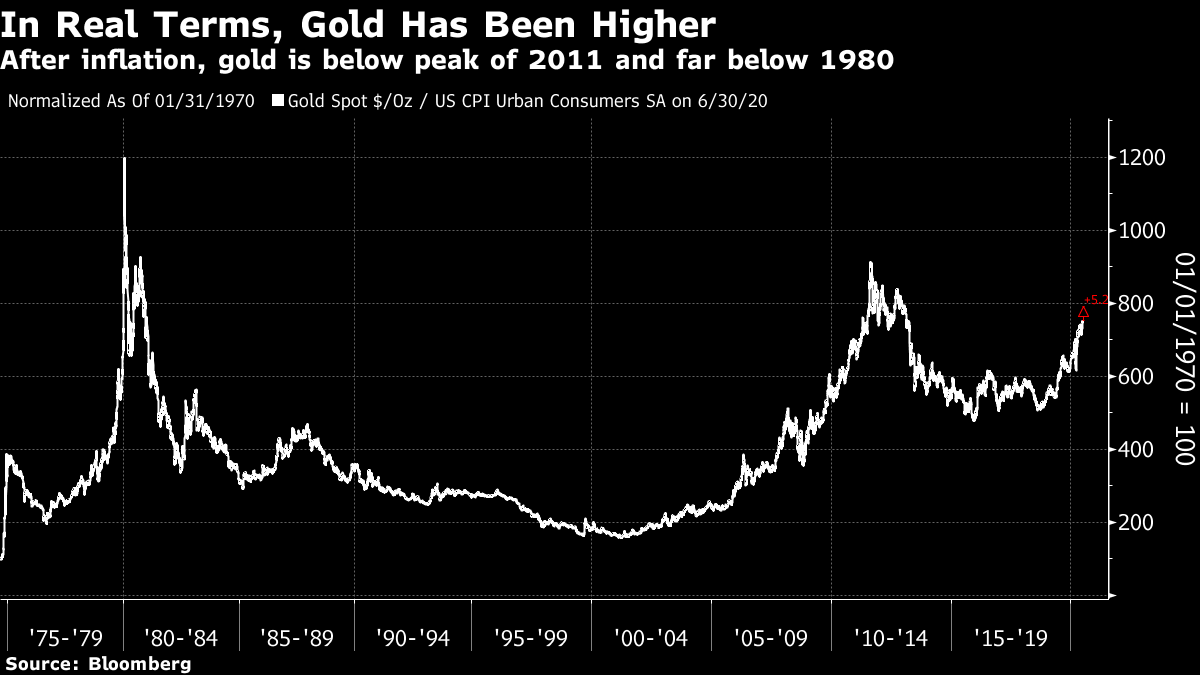 That 1980 rally bore all the classic signs of speculative excess, and was born of the common but often mistaken tendency to extrapolate well-established trends into the future. Gold at that price would have made sense if double-figure price inflation had continued indefinitely. But it didn't. We need to bear this in mind when looking at current projections. It certainly looks from the chart as though gold is bound for the unprecedented level of $2,000 per ounce. Real yields on Treasury bonds are in a historic downward trend, and they overlap closely with the gold price — when bond yields are negative, gold's lack of income ceases to be a problem. The dollar is also weakening against a range of currencies, amid speculation that the time for a prolonged downward wave has arrived. The problem is that it is easy to over-extrapolate these trends. 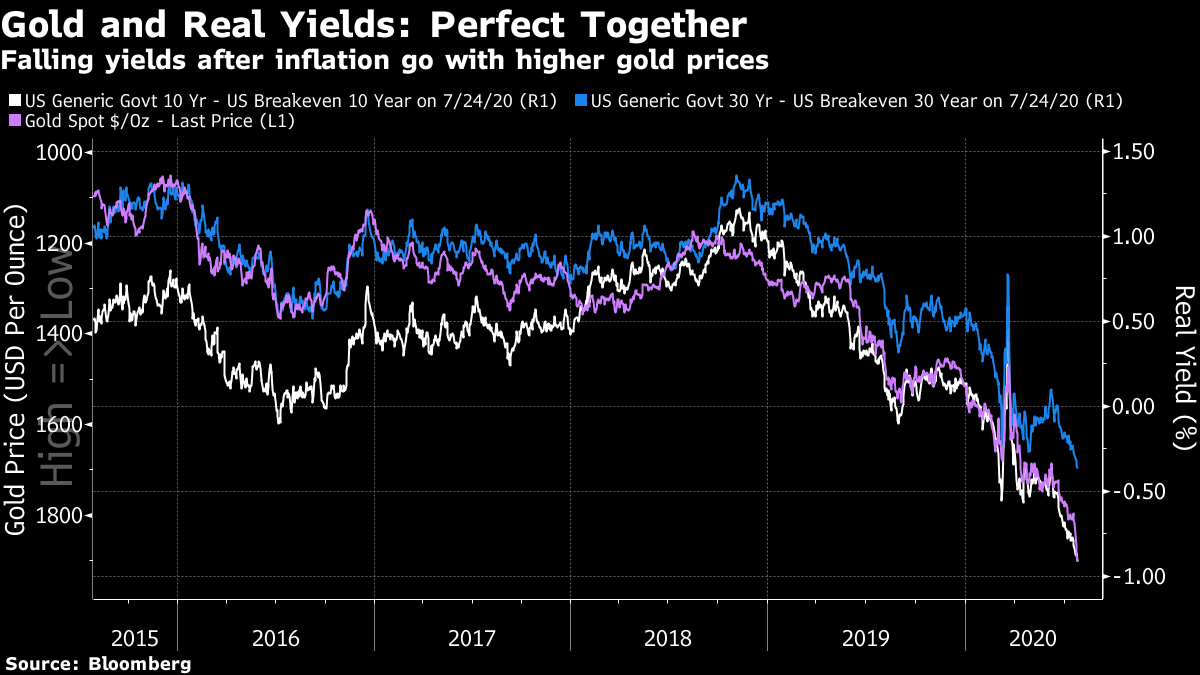 The relationship with real yields is undeniable. But having touched their all-time low from 2012 last week, can they possibly go much lower? Long-term Treasury yields have been flat at around 0.6% for four months, behaving as though the Federal Reserve is holding them there. The decline in real yields has come from a return to more normal levels of inflation expectations: 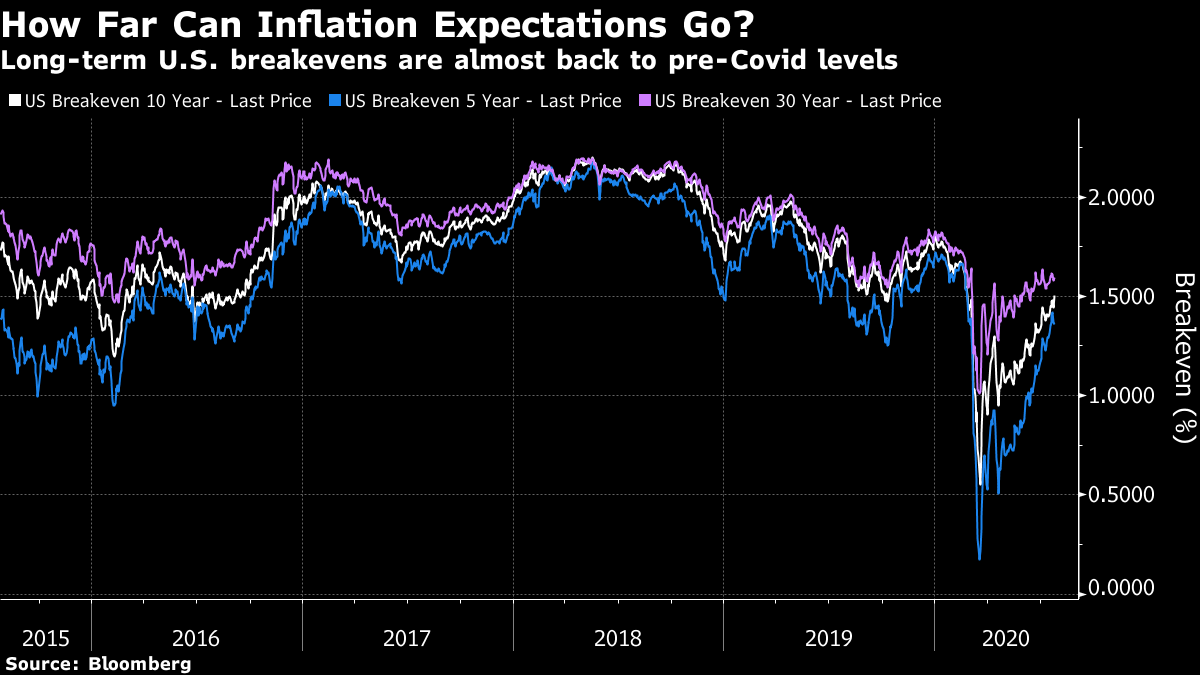 There are reasons to brace for higher inflation. In the short term, the pandemic's impact has been more deflationary. Can we really expect the Fed to keep nominal yields capped even as long-term inflation expectations take off? That is implicitly what bullishness on real yields and gold implies, and there are plenty of ways it could go wrong. So, is gold falling victim to speculative excess? One counter-argument comes from Michael Hsueh of Deutsche Bank AG. He points out that the price increase hasn't been particularly swift or disorderly, with the greatest interest coming from central banks, and particularly, from exchange-traded funds. The GLD ETF now has a market cap of $75 billion, having grown at more than twice the rate of the gold price over the last five years. Meanwhile, speculative positioning in futures suggests the market is less overblown than it was earlier this year: 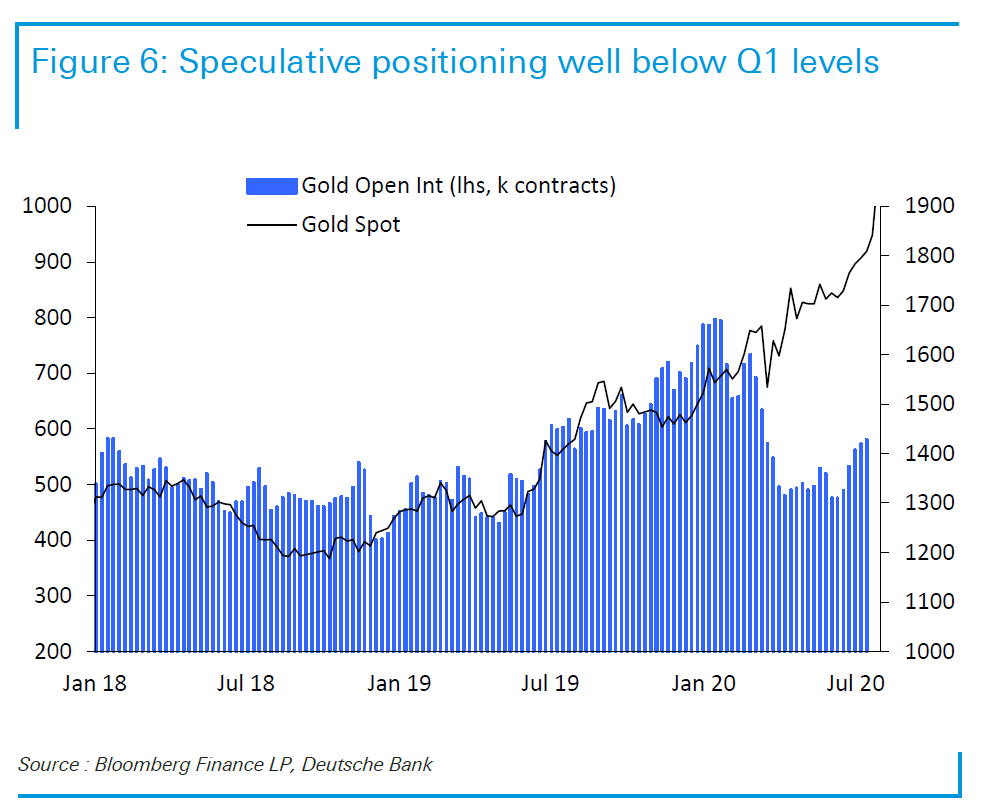 This certainly doesn't look like speculative excess that could lead to an imminent crash. More intriguingly, the rise in trading in "financial" gold — without taking physical delivery of any bars or coins — might bring with it the seeds of a big rise. The theory, which gets technical, is explained here. The issue, in short, is that far more investors are opting to take physical delivery when contracts end, rather than roll them over. This chart from Longview Economics shows the number of contracts that are being converted into physical deliveries. Gold futures are a handy way to hedge financial risks. But they have never been used to buy bullion on this scale before: 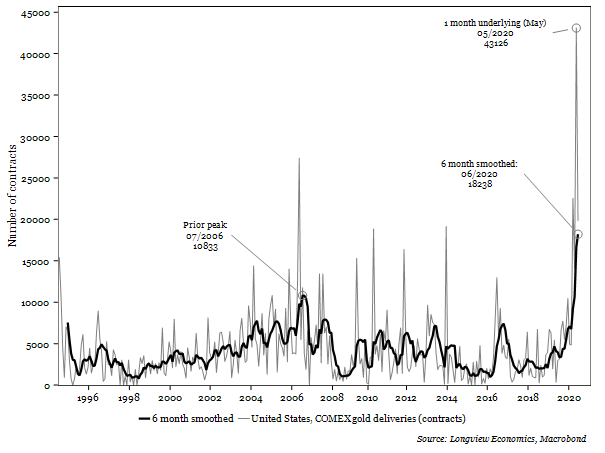 As the next chart from Longview Economics shows, the same trend is at work for silver, although it isn't as extreme: 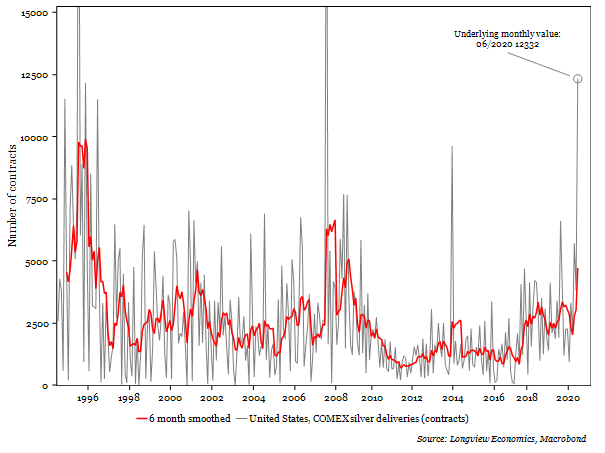 Why is this happening? This behavior is coming particularly from the group labeled "other reportable" in commitment of traders disclosures, which includes family offices and high-net-worth individuals. Worried about protecting the value of their fortunes, they are opting for the perceived safety of physical gold. This creates a specific problem for swap dealers, which are run by the bullion banks that make a market in gold. At present, as the following chart shows, they are very "short" gold, meaning they need the price to decline. If gold doesn't fall, and investors ask for physical delivery, the risk is that they will have to buy bullion they don't yet have. Longview calculates that the bullion banks have a short position worth $39 billion at current prices, the highest since records began in 2006: 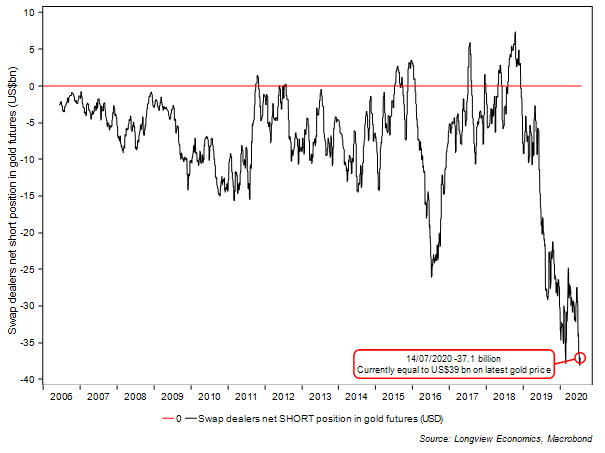 The concern is that we will see something like an old-fashioned bank run, or the remarkable events in the oil price which saw West Texas Intermediate go negative earlier this year. That was caused by an excess supply of physical oil; in the gold market, the fear is of insufficient supply. As Longview puts it: Bank runs occur when lots of depositors demand their money back at the same time. The bank, of course, doesn't keep all their money in the bank. Deposits are lent out as loans (and so on). As such banks suffer short squeezes of liquidity if too many depositors ask for their money at the same time (unless, and until, the central bank steps in with newly created liquidity). Just like in a bank run, therefore, if too many gold future holders decide to take delivery of physical gold at the same time (rather than simply rolling their contracts), then it's likely the swap dealers won't be able to satisfy all those demands (i.e. the physical gold isn't there/available). It's with that backdrop that we wonder if the 'other reportables' investors/speculators are deliberately, or just coincidentally, trying to create that situation (akin to how hedge funds/other investors exploited the lack of storage capacity at Cushing, helping to push the oil futures contract into negative territory in April). If so, then this will be one of those 'rare' occasions when the message of the positioning, sentiment and other models is wrong – and markets don't immediately mean revert but enter into one of their occasional parabolic price moves. The gold price sends valuable signals that other markets take seriously. If a golden bank run does come to pass, there would be ramifications far beyond the market for bullion. A dramatic spike beyond $2,000 would grab attention, arouse deeper fears about inflation, and test the confidence of central banks to keep rates low. It could also pose serious problems for banks and maybe even spark another bailout dilemma. The rally may not yet be excessive. But in the futures market lies the risk that it could become so. Persisting with Persistence What point is there in looking at a fund manager's past performance? As I wrote last month, research from Standard & Poor's Spiva project shows that in U.S. stocks, good performance in one five-year period does virtually nothing to predict the following five years. What is strange is that mutual fund performance used to endure. Now it doesn't. A seminal study by Mark Carhart in 1997 showed that some fund managers persisted in posting better returns than peers. But a new study by James Choi of Yale School of Management shows that this persistence has faded. From 1980, there is no statistically significant way in which we can expect a strong performing mutual fund to keep doing better. The following chart, taken from Choi's article written with Kevin Zhao, shows how much better the top 10% of funds did compared to the worst 10% over the following 10 years. Poor performance seems to persist more than good until recently. But most importantly the thick black line, showing the gap between strong and weak funds' subsequent performance, starts off high, showing persistence, falls for years until a brief return in the years between the dotcom bust and the credit crisis, and then drops into negative territory. At this point, strong past performance has become a reason not to invest in a fund. 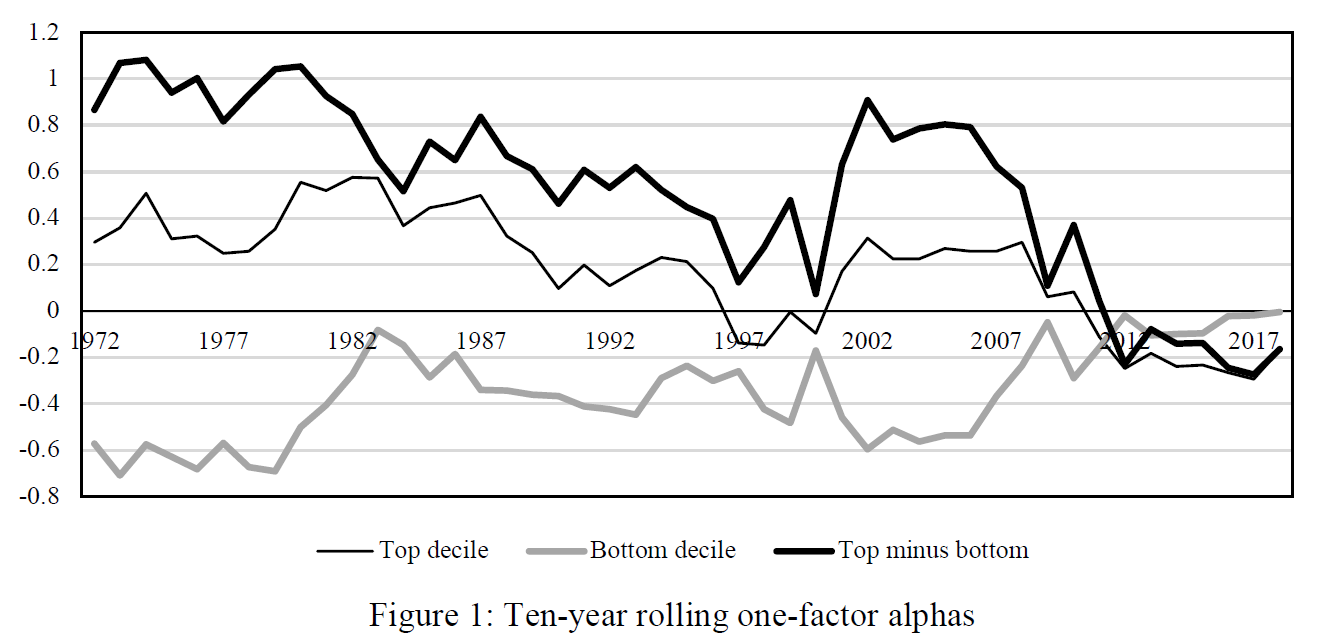 Why might this be? Investment factors have waned over time. The following chart shows that value stocks, picked because they look cheap compared to their fundamentals and labeled HML, after years of showing good performance compared to the market, have been persistently negative in the post-crisis decade. Meanwhile momentum, the phenomenon in which winning stocks tend to continue winning, is outperforming to a far smaller extent than it did in the years when Carhart was conducting his original study: 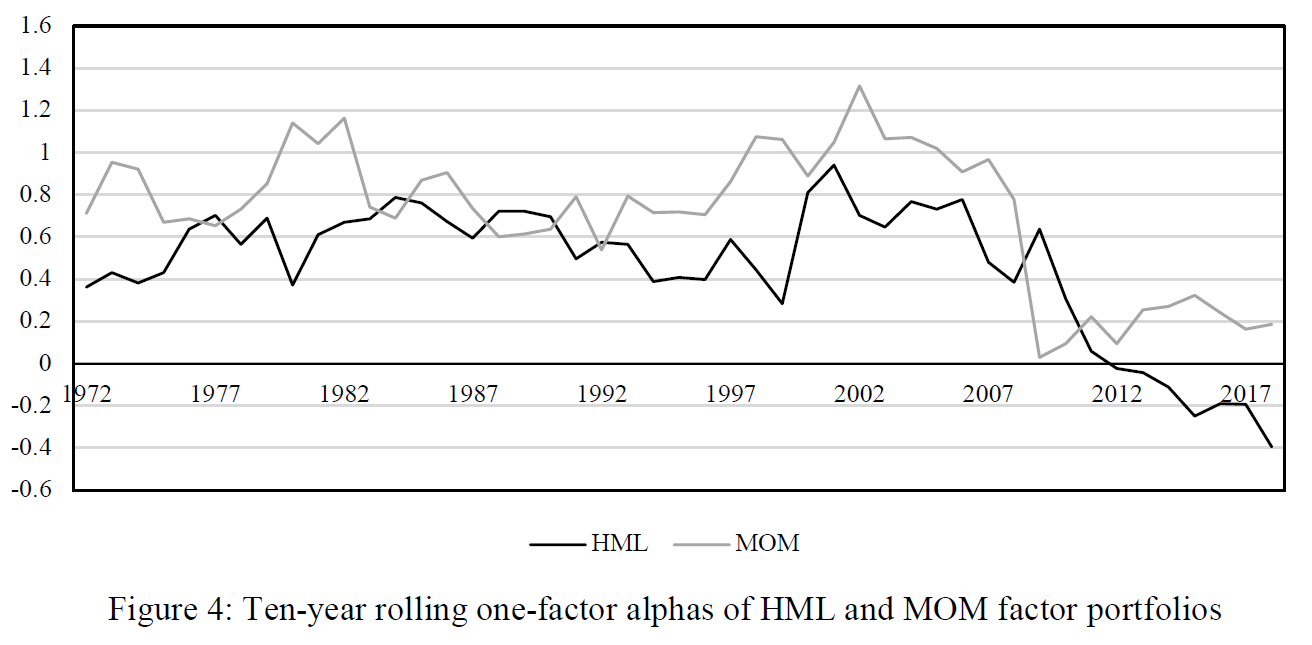 The steady decline of momentum is, according to Choi, the most important reason for lack of persistence. The following chart shows that high-performing funds hold less of their portfolios in high-momentum stocks than they used to (and also far fewer value stocks). "It's a situation where funds aren't doing as much of a good thing as they used to, and the good thing isn't as helpful as it used to be," he says. 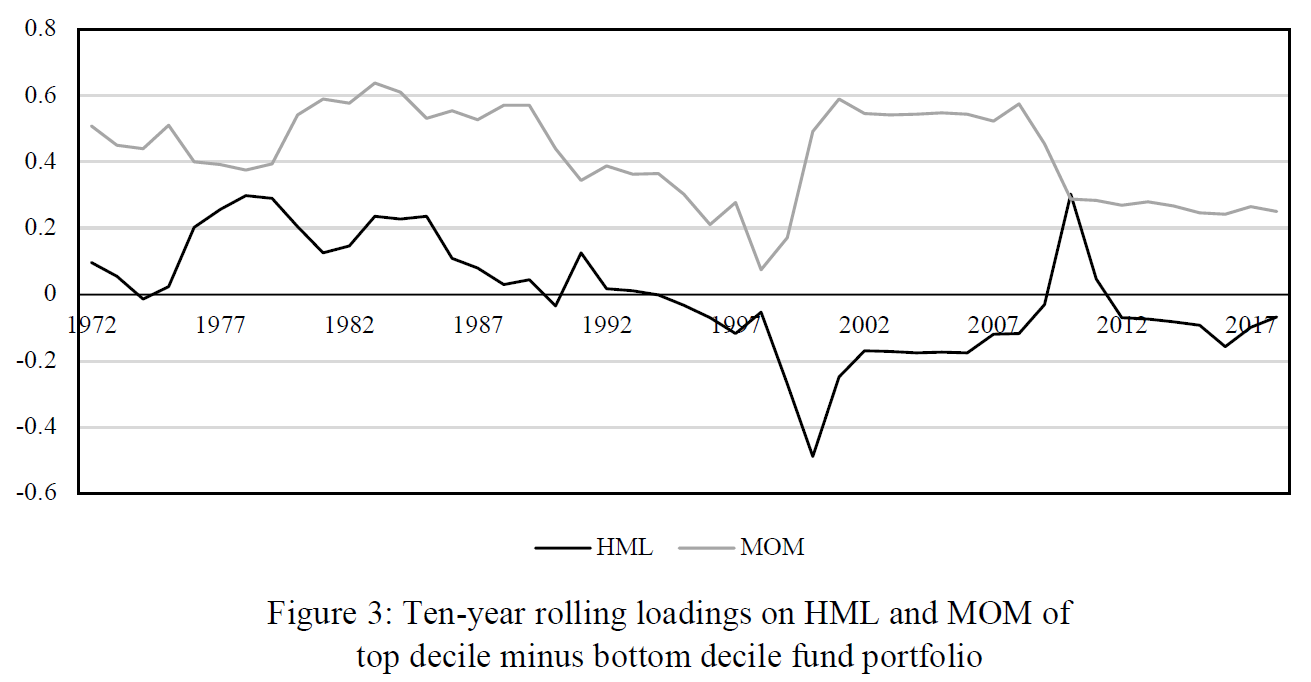 Naturally, all these findings add up to a great argument for passive investment. They suggest that the life of an active manager is a matter of chance. But why would good fund-managing skills be less persistent than they used to be? I can see two main reasons. One is the steady institutionalization of investing. At the beginning of the Carhart study, a large chunk of the U.S. stock market was still held by individuals. Now, stock ownership is overwhelmingly dominated by fund-management institutions, holding money for others. Fund managers can no longer take advantage of "amateurs." Second, there is the progress of financial academics. Finance professors spend much of their time looking for new investment factors that can be shown to outperform. The advent of powerful computing has made it easier to find them. The problem is that once a factor has been identified, prices adjust to take account of it, and from that point onward, the outperformance is over. This may be what has happened to active managers. Their tricks have been commoditized. People will continue to look for new ways to make money. But the last half-century has seen traditional active management turn increasingly into a "loser's game."
Survival Tips
During a brutal heat wave in New York, listening to sports commentary has been a valuable aid to sanity. I've written this newsletter while listening, successively, to England playing the West Indies at cricket, the final day of the English soccer season, and now the Boston Red Sox play the Baltimore Orioles. It's a shame not to have the option of going to a game. But it is reassuring to plug into routine summer rhythms. (O.K., it is a little disconcerting to be listening to English soccer in July, but such is life.) Baseball is also a great test of whether we can return to normal. So far, the auguries aren't great. The sport, which restarted last week, already has been rocked by a series of new positive Covid tests. The Red Sox commentary has been marred by news that our main pitcher Eduardo Rodriguez, who has had Covid, is now suffering from myocarditis, an inflammation of the heart. If these baleful trends continue, then baseball will have to stop again, I fear. The same might apply to the final stages of Europe's Champions League, as the pandemic appears to be picking up again in Spain. That is reason enough to pay attention to sports. Enjoy it while you can. Like Bloomberg's Points of Return? Subscribe for unlimited access to trusted, data-based journalism in 120 countries around the world and gain expert analysis from exclusive daily newsletters, The Bloomberg Open and The Bloomberg Close. | 

Post a Comment