Getting the Story Straight Markets run on narratives. That is because trading in them is ultimately determined by humans, who find it far easier to think in terms of stories than anything else. Express the case for a stock as a series of numbers and it won't connect; knit them together into a story and you have a chance of making the sale. Robert Shiller, Nobel laureate professor of economics at Yale University, devoted all of his latest book to the importance of narratives. With so much uncertainty around the coronavirus, we have a tendency to fall back on those that play to our greatest hopes and fears. That leads naturally to the story of Moderna Inc., which announced results from tests of its coronavirus vaccine that "couldn't have been better," according to the CEO on Monday morning; sold stock Tuesday morning; and then tumbled as Stat, a respected medical journalism site, suggested that the results as published said nothing. I invite everyone to read up and draw their own conclusions. What is interesting is how the S&P 500 came along for the ride: 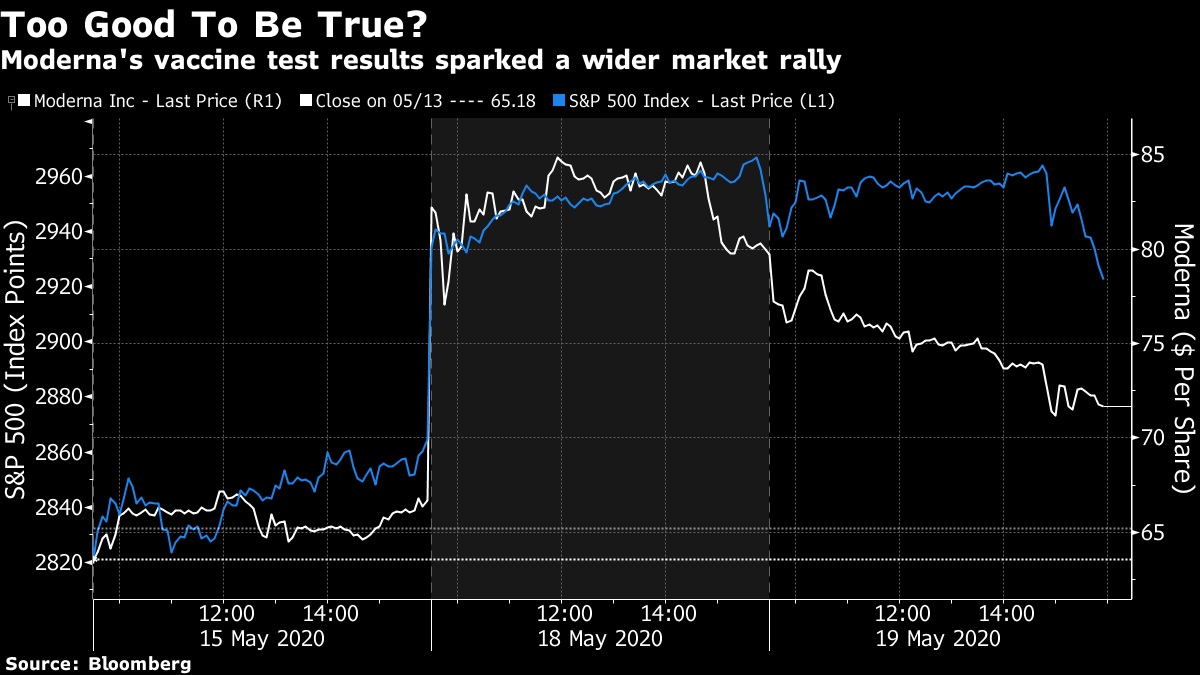 The Monday story, which suggested a coronavirus vaccine might be available in time to thwart a much-feared "second wave" in the fall, had given the stock market its best day in several months. Stat's bucket of cold water helped ensure a bad end to Tuesday with the S&P 500 in negative territory. The episode tells us there is more room for the market to rise, if people can be given an excuse. It also shows the depth of desire for someone to come up with a vaccine that can short-circuit what looks like being at least another 12 months of nervousness, fear, ever more fractious politics, and a sluggish economy — and that the current price is based on some bearish assumptions. Most of all, it demonstrates that with so few precedents to guide us, and with very few knowing the science, the entire debate about the coronavirus is being conducted in rival narratives. This is true in financial markets and in politics. Bulls, bears, and those on left and right are all complicit. I recommend this podcast with Ben Hunt of the Epsilon Theory blog. He suggests that debate has been dominated by three narratives, all of which have been abused: - "It's Just A Flu" (used as a justification for minimizing the entire pandemic);
- "Herd Immunity" (to justify carrying on with economic activity as usual, and risking lives);
- "Flatten the Curve" (to justify continuing with tight lockdown measures even when they have served their purpose).
After the last two days, I might be inclined to add a fourth: "A Vaccine Will Cure Everything." Many believe that life cannot return to anything like normal until we have an effective and safe one. Now, some are moving to a corollary: "Just as soon as we have a vaccine, everything will return to normal." These narratives can be used to appeal to hope and fear, and can play on resentments. Hunt contends that all have become distorted over-simplifications, or heuristics, for understanding a complex world. As it stands, May's installment of BofA Securities' monthly survey of global fund managers shows that many are still in the grip of negative narratives (unless, of course "A Vaccine Cures Everything"). As this chart shows, 68% believe we are still in a bear market, and only 10% believe in a V-shaped economic recovery: 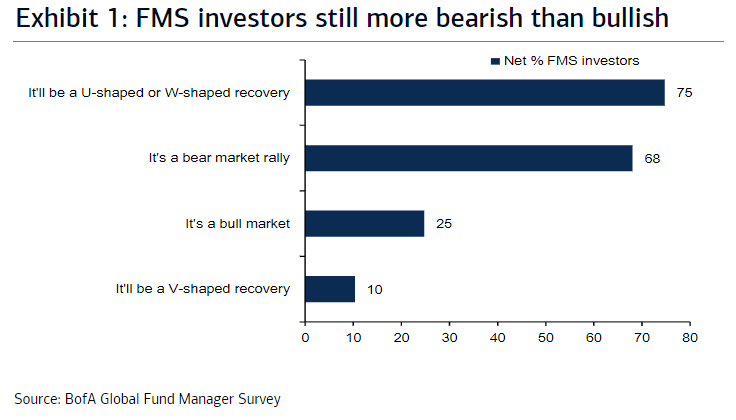 Meanwhile, investors increasingly accept a bearish version of the post-vaccine, longer-term future. It will involve localization, protectionism and higher taxation. Some of the more hopeful possibilities, such as a new impetus toward alternative energy and renewing infrastructure, are seen as much less likely: 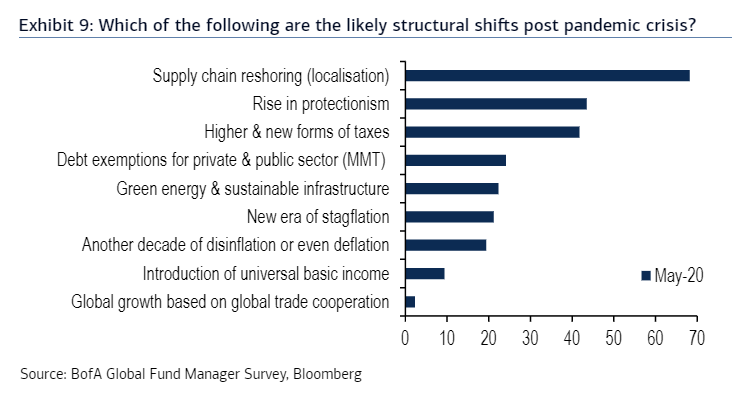 Given that such a negative long-term narrative holds sway, it is fair to say that it is the "Powell Put" from the Federal Reserve that is keeping asset prices aloft. One question raised by the BofA survey is whether to follow what the fund managers are doing, or treat it as a contrarian indicator. If it is a contrarian indicator, then maybe this is the time to buy value stocks. They are further out of favor than at any time since early 2008: 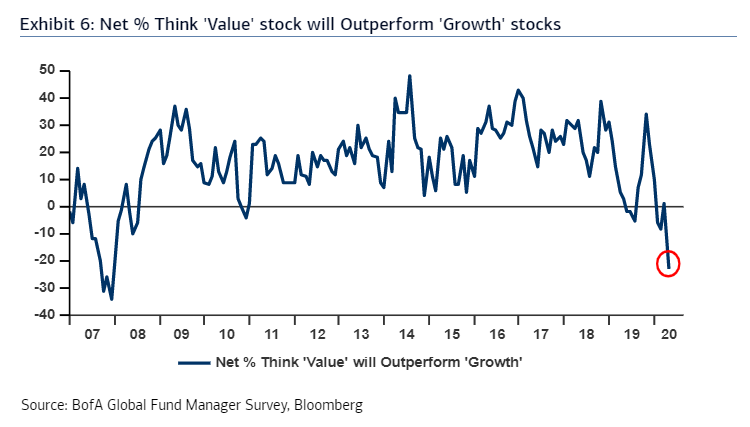 The problem is that it is hard to use the survey for timing, as fund managers have been negative about value for months, and these stocks continue to have a terrible time. It grows more interesting when we look at the perceived greatest tail risks: 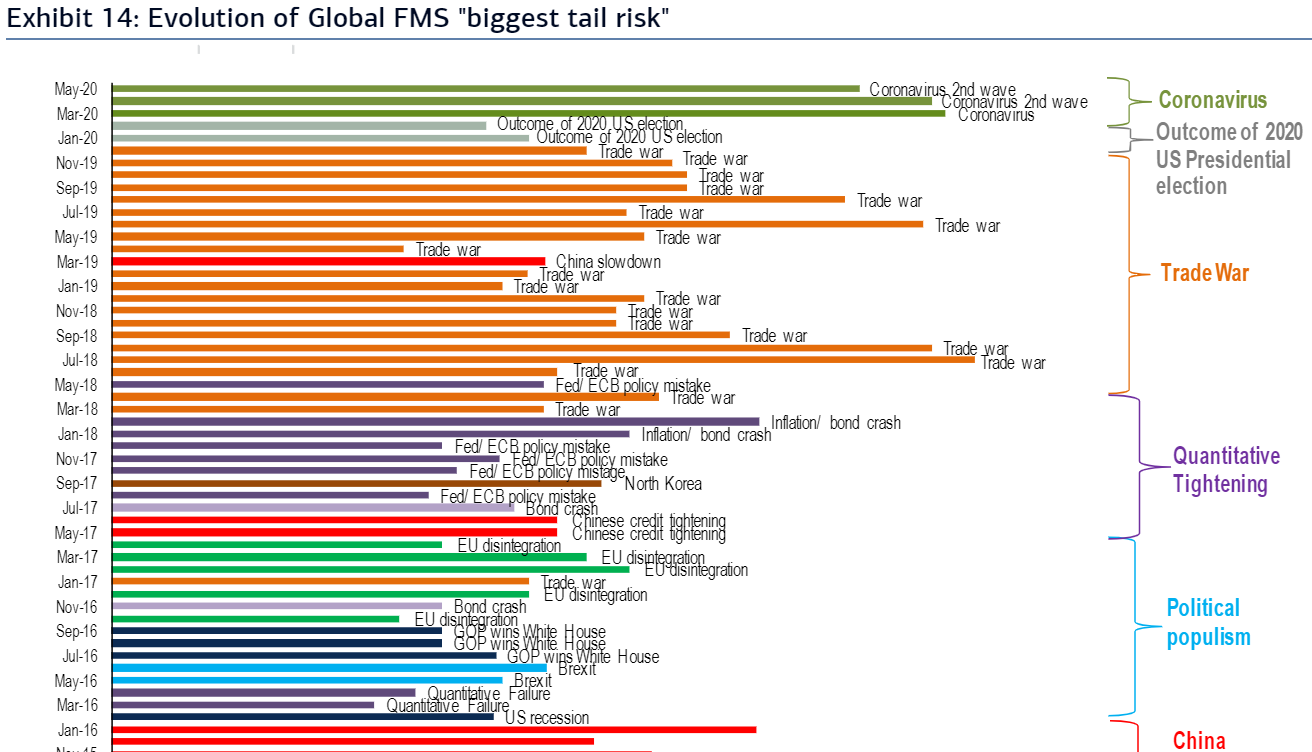 Unsurprisingly, managers' attention is fully occupied by the coronavirus, although they aren't as worried about it, somehow, as they were by the prospect of a U.S.-China trade war in the early months of 2018. It is hard to view coronavirus as a "tail" risk at this point — it is surely part of the most realistic scenario. Now, take a look at the league table of tail risks from the version of this report published Feb. 18, the day before the market topped: 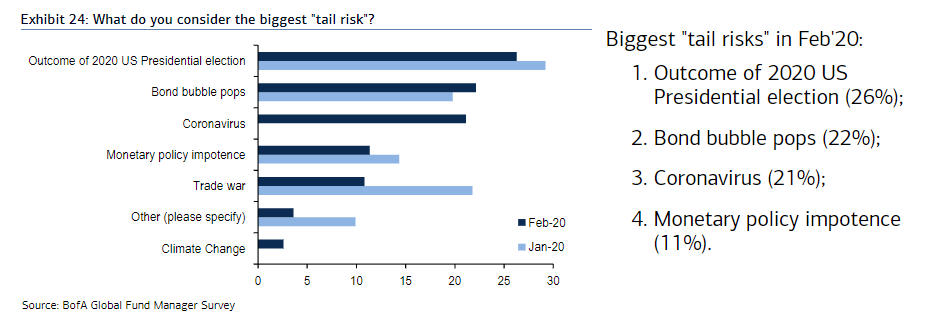 The coronavirus, which had at the time forced the Chinese manufacturing sector to grind to a virtual halt, only made it to number three. Meanwhile the perceived second greatest risk from three months ago, that the bond bubble would pop (meaning yields would rise) couldn't be further from fruition. Bond yields have hit all-time lows since then. Meanwhile, this is the February ranking of the world's most crowded trades: 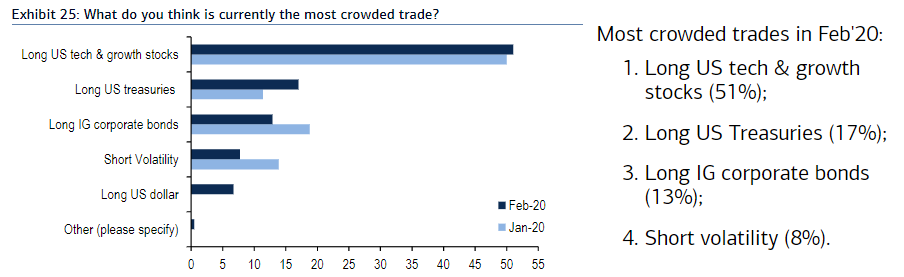 The FAANGs looked like an outrageously crowded trade three months ago. And if anyone bet against them, they have been sorely disappointed. FAANG outperformance has in fact moved into an even higher gear. Betting against the perceived crowded trade in Treasuries would have been painful, too. Something about the FAANG narrative remains very appealing. Actions Rather Than Words If we look at actions rather than words, the BofA report does provide some interesting contrarian signals. It regularly looks at the amount of cash investors are holding. Higher cash holdings show there is money waiting to be deployed, and are a contrarian bullish signal. And in February, this measure was its closest to generating an out-and-out "sell" signal since 2013: 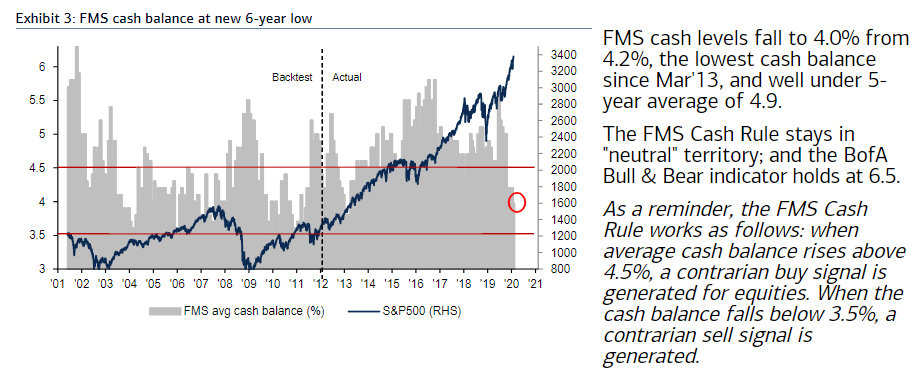 That has changed sharply. Cash balances are now at their highest since the immediate aftermath of the 9/11 terrorist attacks of 2001. This measure now suggests that fund managers are being cautious, and gives a contrarian "buy" signal: 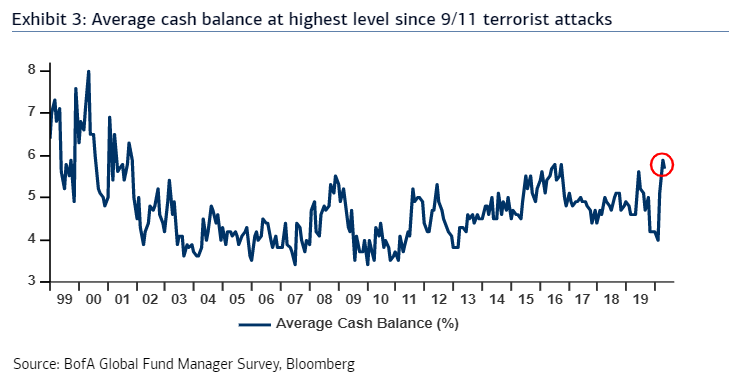 How seriously should we take this? The following chart is from Joe Becker of actuarial group Milliman Inc., and shows the amount held in money market funds as a proportion of total assets under management in equity funds in the U.S. Even if many equity fund managers are giving themselves a little extra cushion, the total cash held by the investing community as a whole remains historically low as a proportion of the amount in stocks: 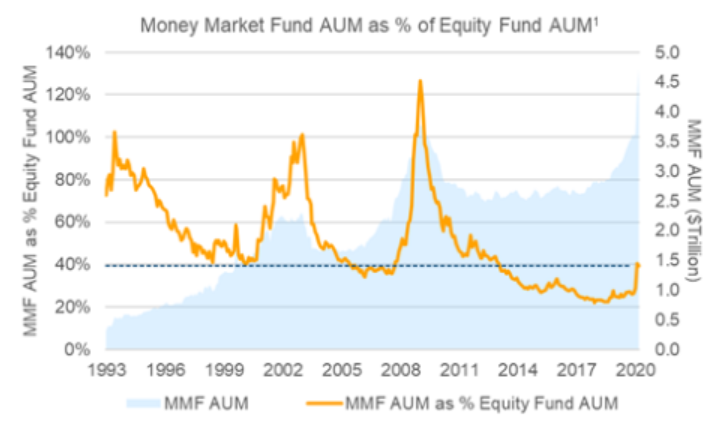 As Becker puts it: "Investors have plenty more room to express a lack of confidence in the economy and the market." Another Narrative: The Laffer Curve Now to return to Shiller. One of his favorite narratives, covered extensively in his book, is the Laffer Curve. Here is a Laffer Curve: 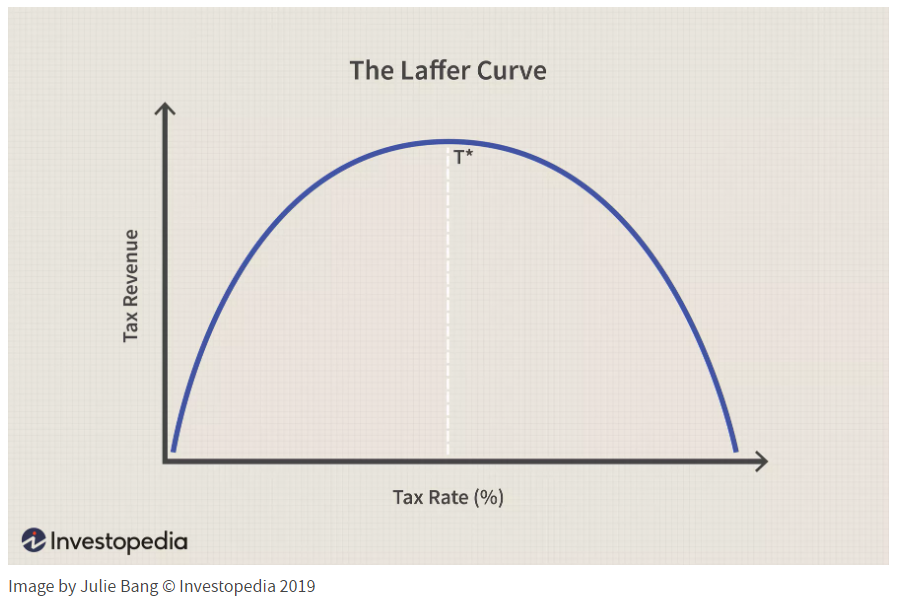 At this basic conceptual level, it expresses a truth that is difficult to deny. The total revenue generated for the government by taxation will be zero if the tax rate is 0% or 100% (in which case nobody has incentive to work). This tells us nothing in itself — most of us have worked out that Utopian ideas such as dispensing with the state or entrusting everything to it are unworkable. What is interesting is the notion that there is a tax rate that maximizes revenue, and that if rates are very high it could be possible to increase revenue by reducing them. This narrative became the backbone of the "supply side" economics revolution under Ronald Reagan. It accounts for continuing excitement over tax cuts. But the problem is that the curve is only a conceptual one. Drawn as above, it implies that the optimal tax rate is 50%, with revenues slipping away equally fast as it decreases or increases from this point. But this isn't empirically based. Back when the Beatles were complaining about 95% tax rates, cuts might well have raised revenue; whether they can have such an effect from current much more reasonable levels is far more contentious. The history of big tax cuts to date tends to suggest that the optimal rate, at least from the point of view of raising revenue, is above where it is now. But the Laffer Curve is a powerful and enduring narrative, and that is in large part because of its origins. You can read the story here. Laffer sketched it out on a cloth napkin. Here is the napkin, which is now in the National Museum of American History in Washington: 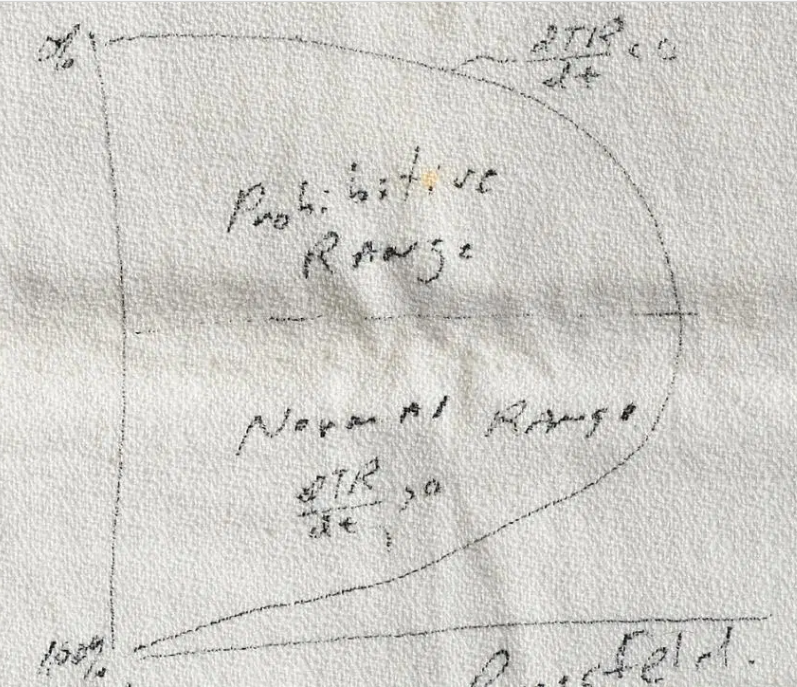 Even better, he sketched it out in a lunch with two young Republican operatives who would become much more famous: future Vice President Richard Cheney and future Defense Secretary Donald Rumsfeld. As Shiller explains, this gives a very light model a narrative power that it might otherwise lack. I raise this because of the news from Larry Kudlow, President Trump's chief economic adviser, that the administration is considering another cut in corporation tax, barely two years after a huge reduction that largely failed to have the effect intended. Either the president's team thinks that the Laffer curve is in fact some kind of many-humped Loch Ness Monster (to name another popular narrative that won't go away), or it is too far in thrall to a good narrative. Survival Tips Some more doses of creativity in isolation. It is difficult to sing a cappella in time and in tune with a group of other singers when you are standing on a stage with them. Doing it at long distance like this, is mighty impressive. This is a special version of Libera Nos (Liberate Us) sung by The Sixteen. It seems appropriate. And for my favorite piece of early a cappella music, try this, by Josquin Desprez. When there's a need to hit the panic button, there's nothing like the unaccompanied human voice. Like Bloomberg's Points of Return? Subscribe for unlimited access to trusted, data-based journalism in 120 countries around the world and gain expert analysis from exclusive daily newsletters, The Bloomberg Open and The Bloomberg Close. | 


Post a Comment