A Groundhog Day Halloween From a distance, headlights look like diamonds . Seen up close they reveal an oncoming car. So the long-distance view isn't the only one we should take. We can see that something is coming, but we may not be sure exactly what. With this caveat in mind, let's look at the clues we have for the long-term outlook on interest rates. In the short term, we have just experienced a Halloween that was more like Groundhog Day. In its essentials, the market action for Oct. 31 was a repeat (albeit somewhat muted) of Aug. 1. Then as now, the Federal Reserve under Jerome Powell had announced a rate cut the previous day, but tried to rule out any more. Then as now, the new day brought a rude reminder that the U.S. and China still had a trade dispute that wouldn't be solved easily or quickly. And then as now, the response was for bond yields to fall while equities dropped, as optimism dwindled. One other common element is now becoming routine. China's official manufacturing PMI suggested the sector was in contraction. So even as stock markets remain virtually at all-time highs, we appear to be locked in a world of low yields (which prop up share prices but inhibit everything else), and an intractable global economic standoff. It's like a continuous loop, and it's easy to attach a narrative of disaster to it, centering on a trade war led by an impetuous U.S. president, and the internal contradictions of China's attempt to use an autocratic communist state apparatus to oversee a capitalist economy. Now let us try some longer-term perspectives. China's manufacturing PMI has been below the level of 50 that is supposed to mark the division between recession and expansion for several months now. But if we apply a 12-month moving average (often helpful when looking at China to help deal with distortions caused by the lunar new year), we see that the country has been in exactly this position before, in 2015-16. Then, as now, the solution was to ease credit. If China can pull off the same trick again, then the world economy should revive in short order. As China also appeared to be heading toward a manufacturing contraction in 2012, this looks like a cycle that is playing itself out regularly. 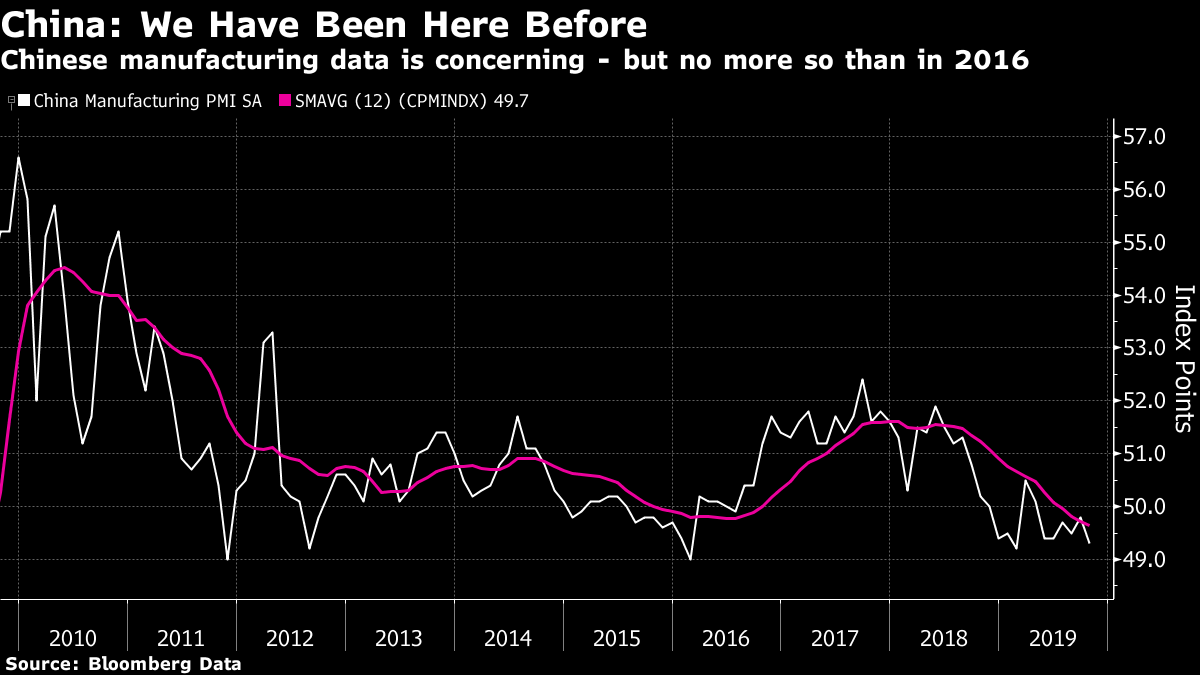 The Chinese PMI bears a close family resemblance to charts of bond yields. In the post-crisis period, they also made lows in 2016 and again this year. Whether correctly or otherwise, China's economic health is perceived as critical to the rest of the world. It is a factor in low rates; and on Halloween we saw yet again the conjunction of disappointing Chinese economic numbers and a fall in bond yields. Trade War and Globalization It's possible to explain China's manufacturing cycle in terms of the country's credit cycle, without invoking the trade conflict. But even without tariffs and counter-tariffs, globalization appears to have stalled. If we measure by the contribution of exports to world GDP, we see three big phases of globalization over the last 150 years. The last one, driven by the rise of China and the end of the Cold War, ended with the financial crisis, when there were widespread fears of imminent currency wars and economic nationalism. That didn't happen at first, but it's easy to see how the current conflict could degenerate into outright deglobalization as seen seen between the wars. The following chart from Capital Economics shows the history: 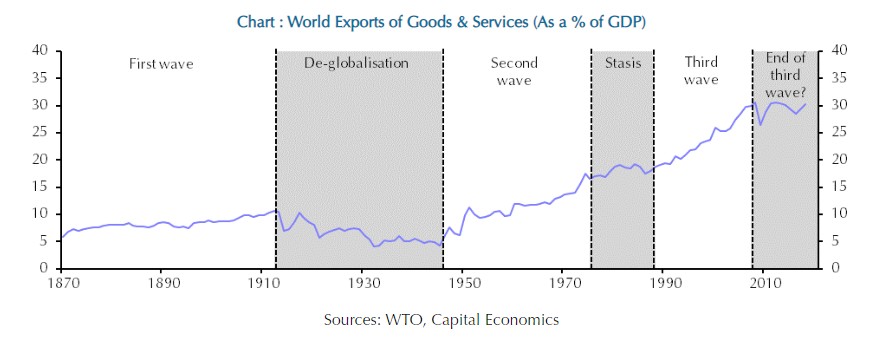 Alternatively we could look at globalization in financial terms. From 1980 until the crisis, the share of GDP taken by liabilities to foreigners exploded, showing far greater financial interconnectedness. That growth has now stalled but not reversed: 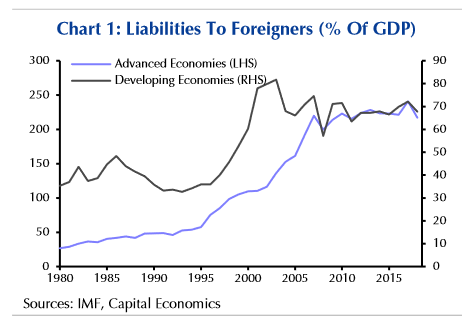 What happens if we move into outright deglobalization, or a reintroduction of a version of the Cold War order, with two systems that try to avoid each other, only this time divided by the Pacific Ocean rather than an Iron Curtain through Europe? Plainly this would have a negative economic effect, although globalization is too well established to turn the clock back to before the fall of the Soviet Union. In such an environment, the profitability of companies would probably be reduced, meaning a long-term drag on share prices. As it would be harder to contain costs, the odds are that inflation would increase, suggesting that bond prices could well fall long-term. That leads to another long-term framework for viewing asset prices. The Supply of Safe Assets Safety is valuable, and people will pay for it. However, another lasting effect of the financial crisis and its immediate aftermath in Europe was to reduce the supply of safe assets. That in turn implies a one-off secular increase in their price and reduction in yield. With the crisis came the virtual extinction of the AAA-rated corporate bond. A range of peripheral eurozone sovereign bonds came under so much pressure that they are no longer regarded as safe, while arguably the stress put on the implicit government guarantees behind the big U.S. mortgage agencies led them to lose safe asset status as well. The following chart, from Oxford Economics, show the effect on the global supply of safe assets. 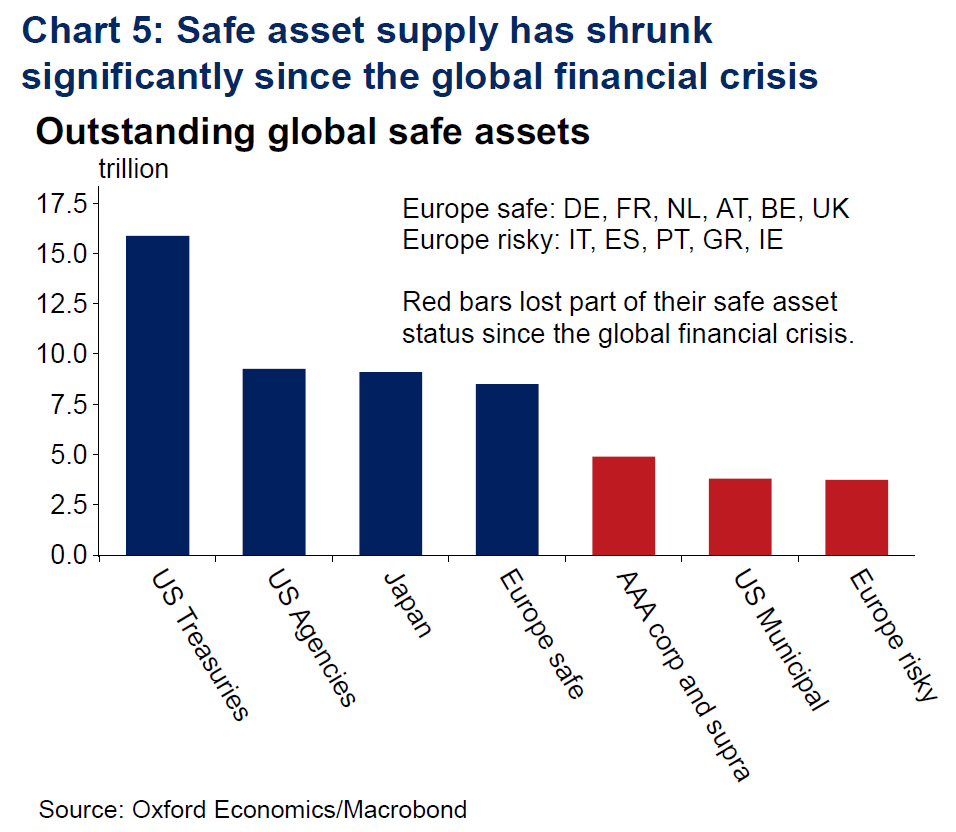 Tighter supply means higher prices. Then comes the issue of demand, which for several years before the crisis was dominated by Asia. That demand has increased, despite a flagging appetite for Treasuries from China and Japan. In the last decade, a pick-up in demand by Asia's newly industrialized economies — South Korea, Hong Kong, Singapore and Taiwan — has more than compensated for this. So, again, the pressure on yields and interest rates is downward: 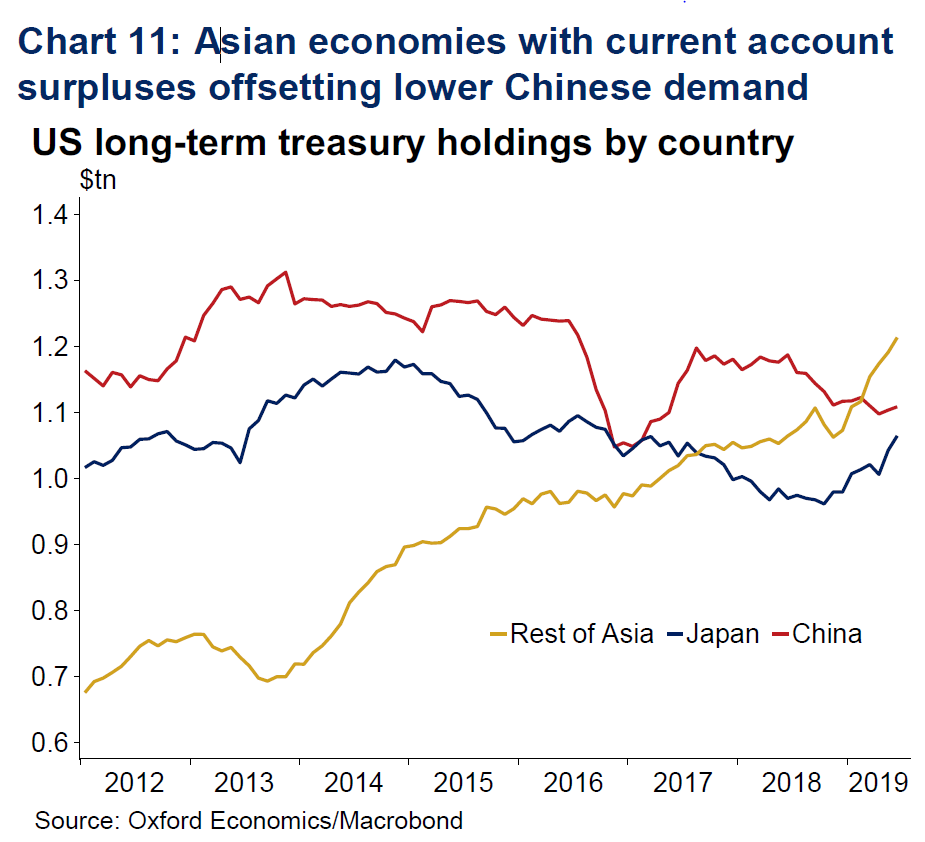 Demand for safe assets also comes from banks, which have been subjected to tighter capital adequacy regulations since the crisis. Without entering into the intense debate over whether this re-regulation was overdone, or insufficient to deal with the serious underlying problems, we can simply say that banks' demand for safe assets has increased significantly. It's hard to see the political will for this to change anytime soon, so this can also be seen as a permanent prop for demand, and therefore for downward pressure on yields: 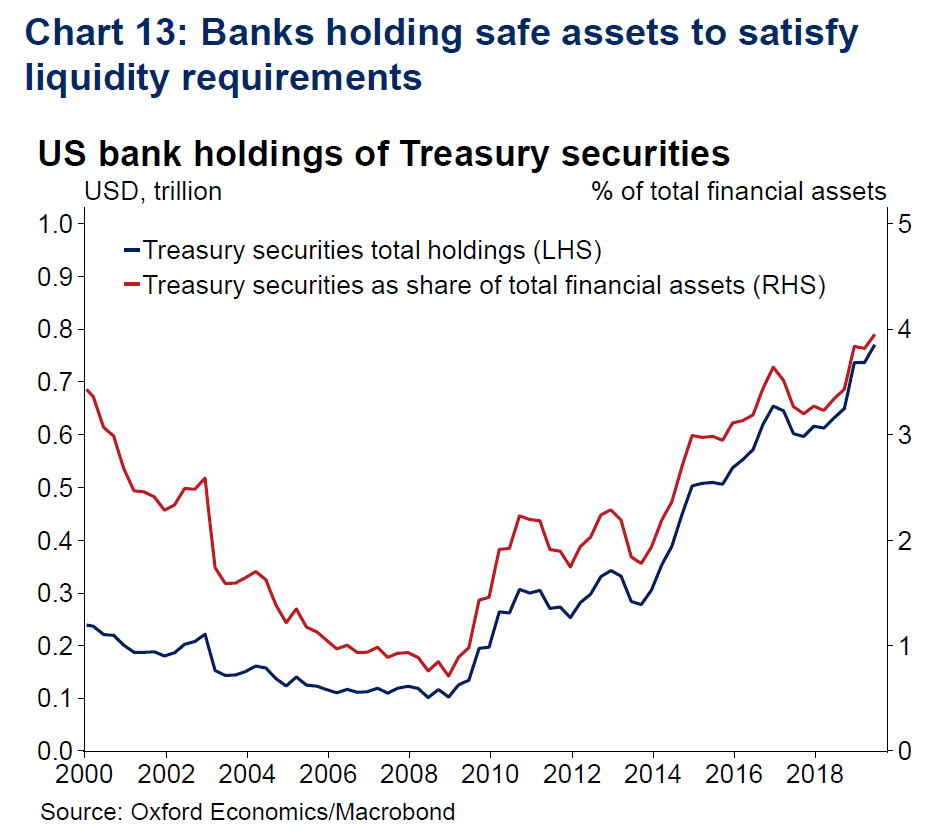 A final significant source of demand comes from pension funds. Those that have promised a fixed amount to pensioners need safe assets to fund their guarantees, while more modern defined contribution plans would also require higher holdings of bonds in retirement. If we look at the demographic trend, in terms of the U.S. proportion of the population aged over 65, we see again reason to believe that growing demand for safe assets is a fact of life for years to come: 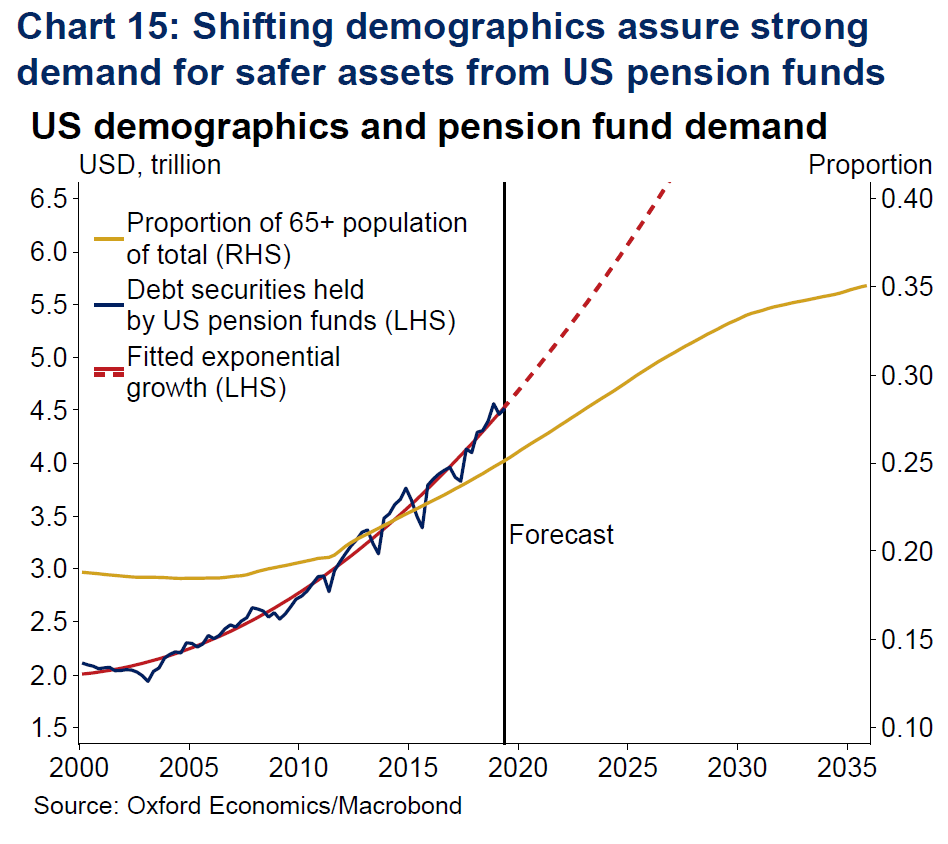 But this leads to a further issue, which complicates the picture: Demographics During the protracted stock market boom of the 1990s, the baby boomers were widely thanked. They were nearing retirement, and socking money into stocks, and this was held as a key reason for excitement. But their retirement led to slowing demand for stocks, and also, crucially, to lower volatility of money. Once people empty their nests and reach their 60s, they tend to spend less. The generation that spends most is aged from 20 to 54. And so, as this chart from London's Longview Economics shows, there's a clear correlation between money velocity and the proportion of the population in that cohort. Since the turn of the millennium, as the baby boomers have aged, it therefore shouldn't be surprising that money hasn't moved around so fast: 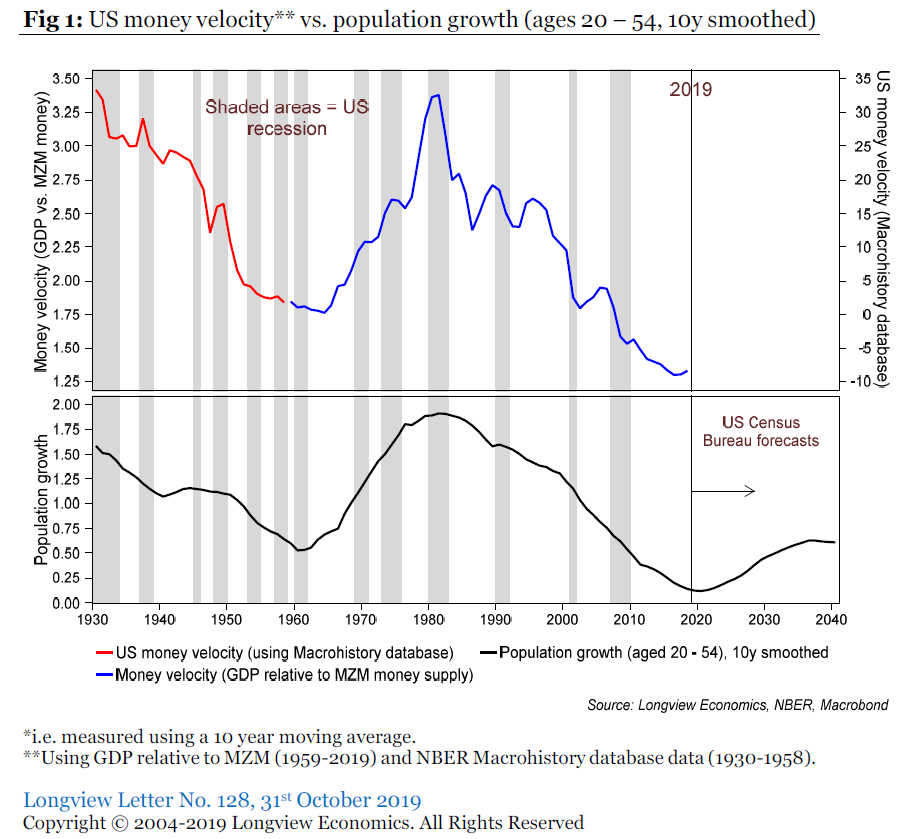 The critical point is that in the next two years we will reach an inflection point, and the proportion of 20-54s will start to rise, even if not to anything like the levels of the 1980s and 1990s. That should mean that we will see a return to inflation. 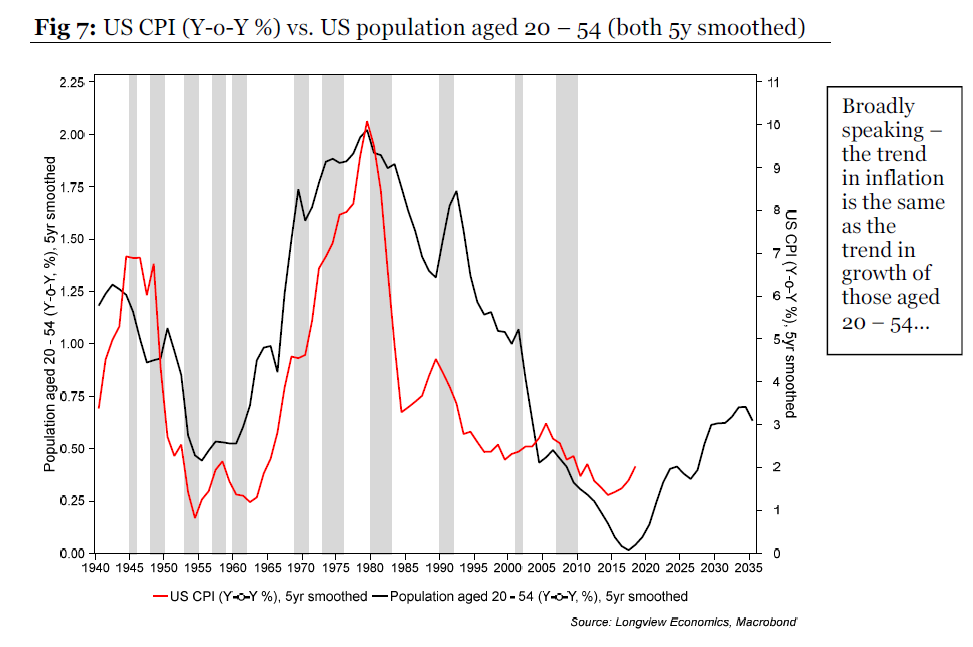 If inflation does begin to pick up, then bond yields will rise, as will the target rates set by central banks. The challenge for asset allocators will grow ever harder. But it becomes far easier to imagine an escape from the trap of low rates. It might even be a little easier to imagine the economy prospering enough to survive a wave of de-globalization, or to fund a growing number of people in retirement. We are in a Groundhog Day existence at present. In the short term, the next round of U.S. data will matter a lot, as will the next moves in the trade war. In the longer run, we need to look at the various bright lights on the horizon. For the time being, it still isn't possible to tell whether they are guiding stars, or oncoming headlights. Like Bloomberg's Points of Return? Subscribe for unlimited access to trusted, data-based journalism in 120 countries around the world and gain expert analysis from exclusive daily newsletters, The Bloomberg Open and The Bloomberg Close. | 


Post a Comment