Boris the Bold Becomes Boris the Reckless Brexit isn't going to be happening on Halloween (that is, tomorrow). Neither will it happen next month or, it is now virtually certain, this year. Instead, followers of British politics will get to watch a general election on Dec. 12. As at least four different Brexit policies will be on offer from at least four viable political parties, and the British electoral system can easily produce perverse results, the bottom line is that the situation has just grown far more uncertain. That must be the bottom line for investors, which can be illustrated with this flow chart produced by RBC Capital Markets last week. For those lucky enough not to be living and breathing this subject, this was the day when the prime minister brought the exit deal he had reached with the rest of the European Union to parliament, and won an initial approval. (It still needed to pass a final vote to become law.) 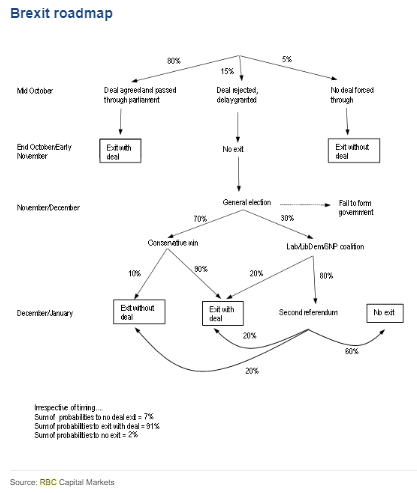 At the start of last week, RBC's chief foreign exchange strategist Adam Cole saw an 80% chance that the Johnson deal would be agreed, leading to exit with a deal in late October or early November. Meanwhile there was a 15% chance that the deal was rejected and the EU gave the U.K. an extension, and only a 5% chance that the deal fell in parliament and the EU responded by kicking the U.K. out without a deal. These three options add up to 100%. Yet something different has occurred. The deal was neither agreed nor rejected. It passed with the help of Labour MPs who thought their constituents wanted Brexit to happen, but Johnson's attempt to force through the final reading of the bill in three days was narrowly voted down. The EU provided an extension, offering parliament time to dot the "i"s and cross the "t"s of the bill. Instead, Johnson decided to pull the bill and renew his call for a general election. That leaves two questions. First, and more importantly for investors, how does this change the probabilities for an eventual Brexit? And secondly, and perhaps more importantly for me and many of my fellow baffled Britons, why did the prime minister suddenly turn back when triumph was almost his? On the first question, the middle of Cole's flow chart now applies. We move to a general election, at which he puts the chances of a Conservative victory at 70%, and of a victory for some coalition of anti-Brexit forces at 30%. The wider the Conservative majority, the less Johnson would need to appease the ardent Brexiteers on his right, and the less likely "no deal" becomes. So in this scenario, there is a 90% chance of a negotiated Brexit (probably quite a "hard" one), and a 10% chance of no deal. If Labour, the Liberal Democrats and the Scottish Nationalists take power in some combination, then there would be a 20% chance of a negotiated "soft" Brexit, according to Cole, and an 80% chance of a referendum, offering a choice between (a soft) Brexit, or remaining. In these circumstances, remain would probably win. Given the polls, I would agree with these odds. A Conservative victory is the most likely outcome, but nowhere near a certainty. The Conservatives are comfortably ahead — but not as far as they were at this stage in 2017, when they disastrously failed to win a majority under Theresa May. Labour's position now makes a referendum virtually certain if they are part of any governing coalition. By my count, that makes the current odds: No Deal 7%, Hard Negotiated Brexit (under Conservatives) 63%, Soft Negotiated Brexit (under the other parties) 7.5%, and Remain 22.5%. So, a negotiated Brexit remains the most likely option, but its chances have dropped from 91% last week to 70.5% now. Meanwhile, the chance of canceling Brexit altogether has risen from 2% to 22.5%. The risk of no deal is unchanged. Markets are used to trading on a binary question: "No deal or not?" This probably explains the market's muted response. But beyond that, uncertainty is sharply higher, and the option of staying now seems viable again. The fact that uncertainty has ratcheted up, and that remain is back on the agenda, also sharply increases the risk of civil unrest. That leads to the second question. Johnson had a chance to "get Brexit done" but has instead opted for a course of action that sharply increases the chance of no exit. Meanwhile, opposition parties have let him call an election when he is ahead in the polls. Why did they do this? I recommend this piece by Alan Wager of The UK in a Changing Europe. He asks if Johnson could have passed his Brexit bill with a few more days of debate and answers "yes." There were enough Labour MPs from Leave-voting constituencies who had shown they were serious about wanting to vote for a Brexit. The Liberal Democrats and the Scottish Nationalists, who both want to stop Brexit, probably grasped this. That is why they agreed to an election, leaving Labour with no choice but to go along with them. Johnson presumably thinks that December, a challenging time to hold an election in the wintry British Isles, is his best chance to consolidate power. The polls suggest he might well be right. These are the implied probabilities derived from bookmakers' odds, as compiled by Cole of RBC: 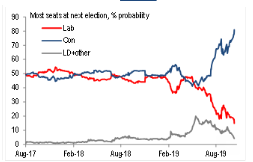 Such numbers must have made an election hard to resist. But the polls failed to predict the results of the last two general elections, or of the referendum. At best, his actions seem reckless. And they have also virtually ensured that the relative calm that has settled on British asset markets in the last few days will soon be broken. Here is a prolonged puzzle. Over the last quarter-century, trading during market hours in the U.S. stock market has lost money. This is true even though the stock market as a whole has, as we know, risen impressively over that period. The reason for this is that almost all the price action happens at the open. This chart from Ned Davis Research Inc. shows the phenomenon clearly enough. Davis refers to it as the "Goodnight Moon trade." The black line is what you would make if you bought at each day's closing price, and sold immediately after the following day's opening. The red line is how you fared trading at all other times during the day: 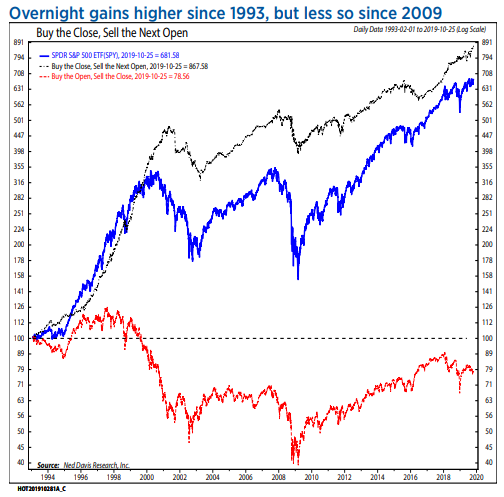 Many people have brought this to my attention over the years, and many find it sinister. I have never found it that surprising. The market may not be a perfectly efficient "random walk," ceaselessly incorporating the latest news, but for much of the time it does behave that way. The great bulk of potentially market-moving news comes out while the market is closed. The bulk of volume is also at the open and again at the close. So it makes sense that most of the market's gains happen at the open. That leaves trading hours as a time for suckers to take part in a zero-sum (or maybe even less-than-zero-sum game) trying to outwit their competitors. Ned Davis himself also seems somewhat unbothered. His guess is that "a combination of Globex, where futures trade at night, plus high-frequency trading where algos try to front run trends, has created a case where a lot of good news `prices in' by the time the market opens." Added to this, algo traders have probably figured out the bias, because he has seen a "firming tendency late most days to try to front run this impact." This might explain why the effect is much less marked post-crisis (when the red line for day traders has made steady advances). The bottom line is still, I believe, that day-trading is a mug's game. This brings us to a prominent exception. We are about to undergo one of the eight Federal Open Market Committee days that come along each year. At 2 p.m., with two hours of trading still to go in the stock market, the Federal Reserve announces whether it is changing monetary policy. Barring emergencies, it will have to wait another six or seven weeks before it can make another change. FOMC meetings are a huge deal, and it only makes sense to respond to them as quickly as possible. These days, however, with a press conference following 30 minutes after the announcement, the job of day-traders grows more complicated. Back in July, the Fed announced a rate cut, as expected, only for Jay Powell to dismiss the move as a "mid-cycle correction" less than an hour later. Powell has now accumulated a history of using his press conferences to convince the market that he is hawkish — which is generally what Mr Market does not want to hear. Bespoke Investment Group published this beautiful composite chart of the average course of the S&P 500 during the 13 Powell FOMC days to date. 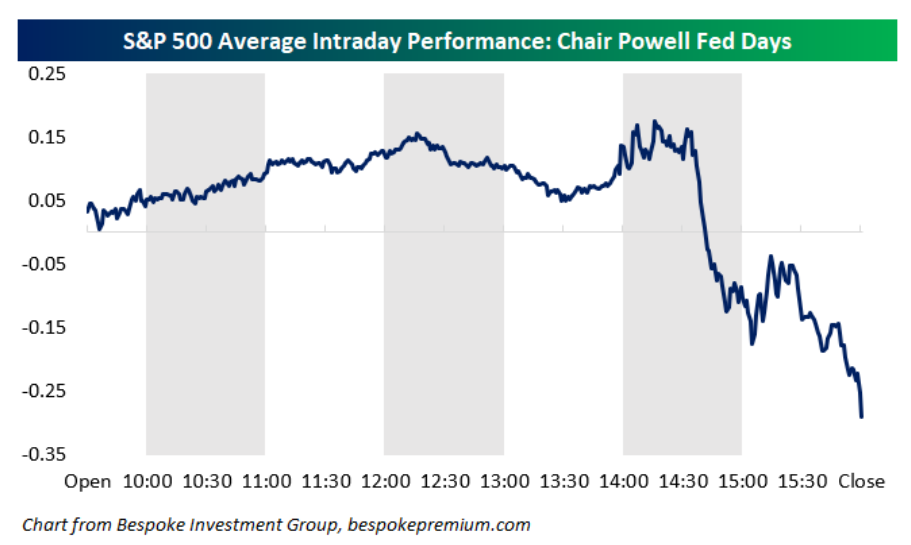 Note that the announcements on rates have tended to net out to neutral, but the Powell pressers tend to hurt the stock market. (And as it is in no way his remit to boost the stock market, this shouldn't bother him). Now we get into the complexities of game theory and mass psychology. Just as algos may have awoken to the Goodnight Moon trade, are traders braced for a display of hawkishness from Powell? They probably should be. Not only the accumulated evidence from his tenure so far, but also the facts of this particular situation argue for a "hawkish cut." The market has backed the FOMC into a corner, with a cut priced as a virtual certainty. The Fed cannot disappoint them. But we know that the FOMC's members are divided, and that like all central bankers they are nervous about cutting rates. Powell is widely expected to try to sound as hawkish as he can. Could this be the point when Powell tries to stake out his hawkish credentials once again, and stock market day-traders, mugs though they are, show they have at last learned to anticipate this and price it in? We will know soon enough. Like Bloomberg's Points of Return? Subscribe for unlimited access to trusted, data-based journalism in 120 countries around the world and gain expert analysis from exclusive daily newsletters, The Bloomberg Open and The Bloomberg Close. | 


Post a Comment