The Price of ValueSomething's happening to value stocks. They're recovering. This has had a big impact on stock markets this year, as many of the 2020 champions have suffered a correction. It has also been great for active fund managers, many of whom are committed to a value style. It was difficult to beat the market when that required taking big positions in half a dozen stocks that already looked way overvalued; arguably the only way to do so was to be wildly irresponsible. This year, active managers begin to look both savvy and responsible. But the nagging question remains: Is this anything more than noise? Value endured a poor post-crisis decade followed by an apocalyptically bad two years, which ended in the pandemic. The period has been punctuated by false dawn after false dawn. That leaves many of us (including me) feeling like Charlie Brown, landing on his back as Lucy yet again pulls away the football. So, what is going on, and is there evidence that value can endure this time? First of all, the recovery so far is real and spectacular. As of Friday's close, Bloomberg's measure of pure value return had regained everything it lost during the pandemic selloff. It has actually gained, once all other factors are screened out, since the beginning of last year. The speed of the reversal is unlike anything seen in the past decade, barring the collapse last spring: 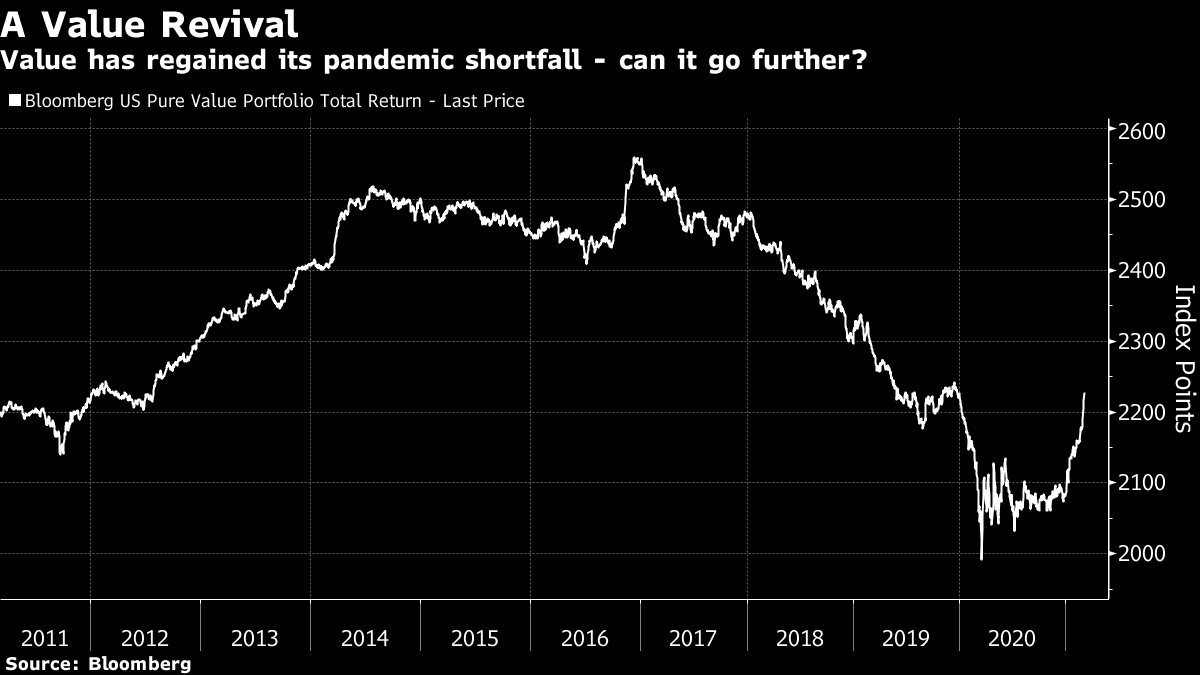 Looking at the longer term, February was the best month for value compared to growth, among the large-cap stocks of the U.S. Russell 1000, since March of 2001, when the market was still dealing with the impact of the dot-com crash. That has continued into the current month — but boy is there a long way to go before value makes up all the ground it has lost: 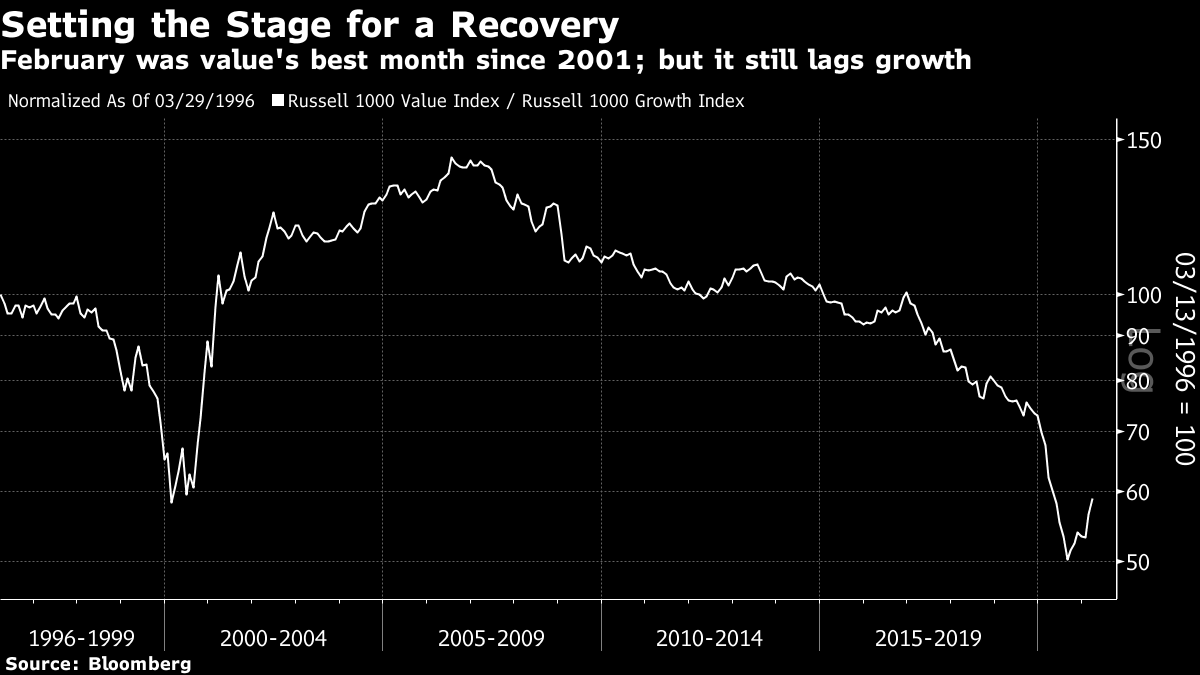 How reasonable is it to expect value's outperformance to continue? One vitally important point is that it is still relatively cheap. For a crude measure, the following chart compares the spread between the forward price-earnings multiple of the Russell 1000 Value index and the main Russell 1000. More or less by definition, the value index is almost always cheaper. It looked fantastically cut-price during the dot-com bubble, and followed that with massive outperformance. It looked very expensive by the eve of the global financial crisis, and unsurprisingly collapsed thereafter. It now looks very cheap again: 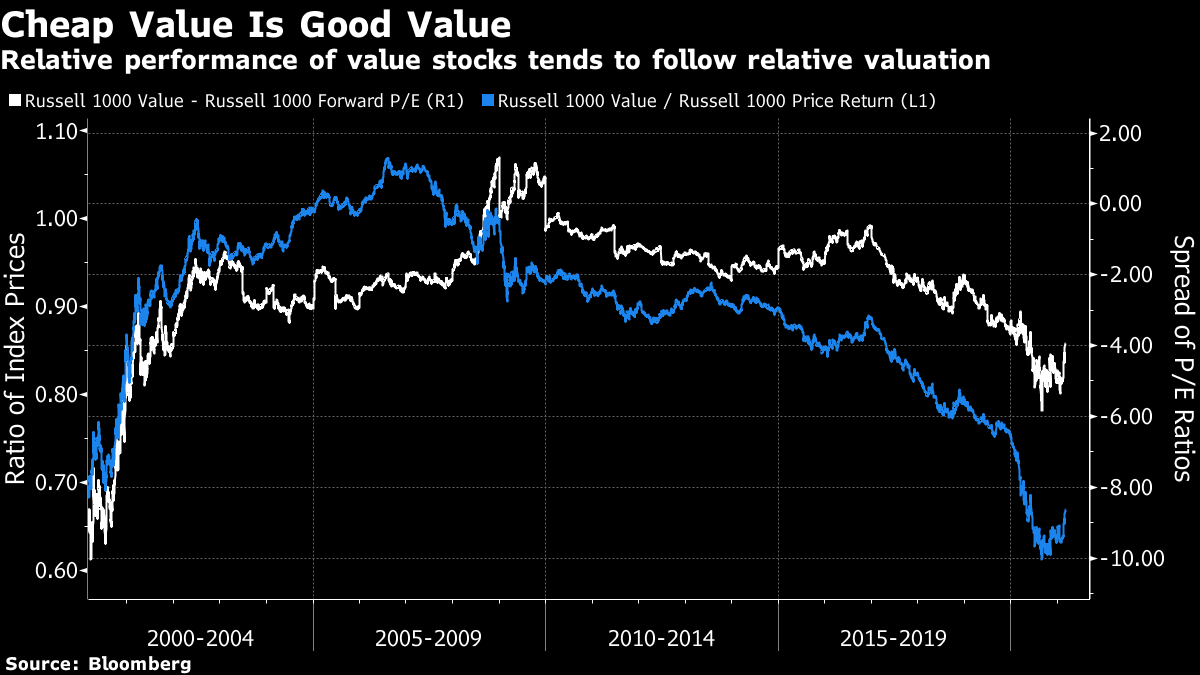 Alternatively, we can compare the spread in the book-to-price multiple for value stocks compared to the market as a whole. This is traditionally the ratio used to define value in academic studies. On that basis, value looks cheaper than at any time since the data started in 1950, according to the following chart produced by Cliff Asness of AQR Capital Management: 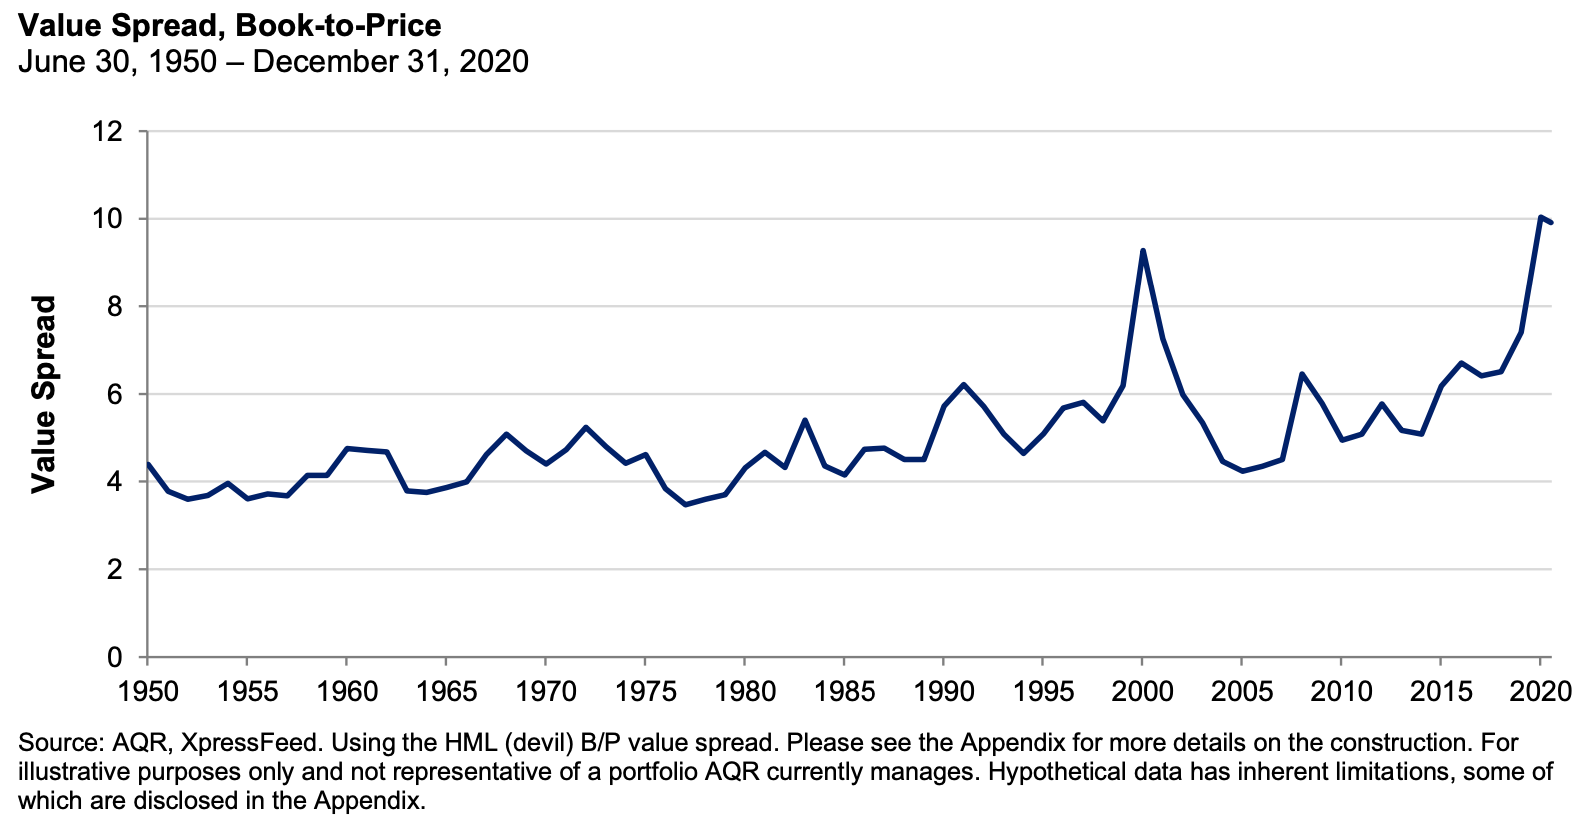 In a fascinating and lengthy piece provocatively entitled "The Long Run Is Lying to You," Asness looks at returns to factors once valuation is taken into account. The kernel of the argument is: one of the major things that buffets realized average returns is changes in valuations. To state the obvious, when strategies get more expensive, all-else-equal they do better while that richening is occurring – not necessarily afterwards when it's starting out expensive!…
when you estimate long- term expected returns accounting for valuation changes, you get a significant gain in the precision of your estimate (not just a different, less biased, estimate). How many of our well-known "facts" about expected returns, risk premia, and popular investment strategies are substantially influenced by prior valuation changes that are very dodgy to assume will repeat going forward? Not to ruin the suspense but the answer is a lot.
Value stocks have done terribly for the last decade. But given how they have grown cheaper relative to others, we should expect them to do better in future. Asness's argument is long, and includes some math. It is worth taking time with it. For the time being, the basic intuition is that if we knew in advance how the valuation (meaning the cyclically adjusted price-earnings ratio) of the S&P 500 would change each year, we would have an almost perfect trading strategy. Since 1950, the S&P has each year gained an average of 5.2%, plus 95% of the change in the CAPE. This relationship has a 92% correlation. The only problem is that we don't know in advance how valuations will move, even if they do tend to revert to the mean in the very long run. The outcome for bonds, with change in yield substituted for change in CAPE, is almost identical. Asness also applies the methodology to the relative performance of the U.S. stock market and the rest of the world (proxied by MSCI's Europe, Australasia and Far East index). The U.S. has outperformed EAFE by a bit more than 2% per annum over the last 40 years — the thick line in the graph gives an idea of how much of this is attributable to greater richening of valuations in the U.S.: 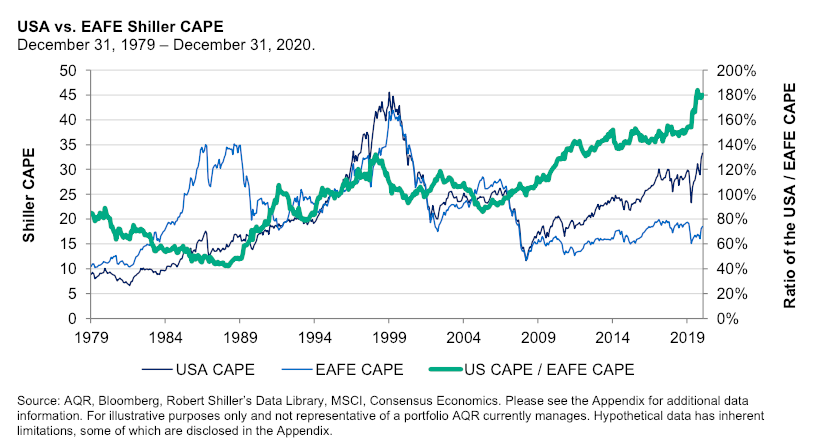 By Asness's estimate, the U.S. outperforms the rest of the world by 0.4% per annum, plus 94% of the change in valuation. If you know the change in valuation in advance, you more or less know what will happen. But you must beware not to extrapolate this shift from the past into the future. In the case of the U.S. and EAFE, you should extrapolate a 0.4% difference, plus the change in valuation, rather than 2.2%, which would imply a continuing widening in valuations until infinity. Now to apply this to the value factor. Going back to 1950, using book multiples, Asness's regressions yield an annual return for U.S. value stocks of 4.0% minus 91% of the change in the spread with valuations of expensive stocks. The more that spread widens, the worse a value strategy will do. None of this has anything to do with timing. Plainly, if the shift toward an inflationary regime causes valuation spreads to tighten as the economy raises all boats, then that would be a reason for value to start doing better. For the longer term, the extent that value's underperformance has been driven by valuations means that it makes sense to expect value to outperform in the future. What should this mean for investors? Asness says: not overestimating bond and stock market expected returns due to ending high valuations, not overestimating USA versus international equity returns because of the same, but not underestimating the value factor return because expensive stocks are now priced so high versus cheap ones. It would not be going too far to say that avoiding these misestimations, in both directions, and the portfolio misallocations they bring is a large part of the job of a long-term investor.
I hope this was a fair summary, and I encourage everyone to read his piece. Long Run Means PatienceNone of this means that factors don't have to withstand lengthy droughts from time to time. The following chart is from the latest edition of Credit Suisse Group AG's Global Investment Returns Yearbook, compiled by the British academics Elroy Dimson, Paul Marsh and Mike Staunton, which I mentioned last week. In the U.S., investors in value have been underwater for 37 years and counting, relative to the market. Nobody should think of factor investing as a "free lunch": 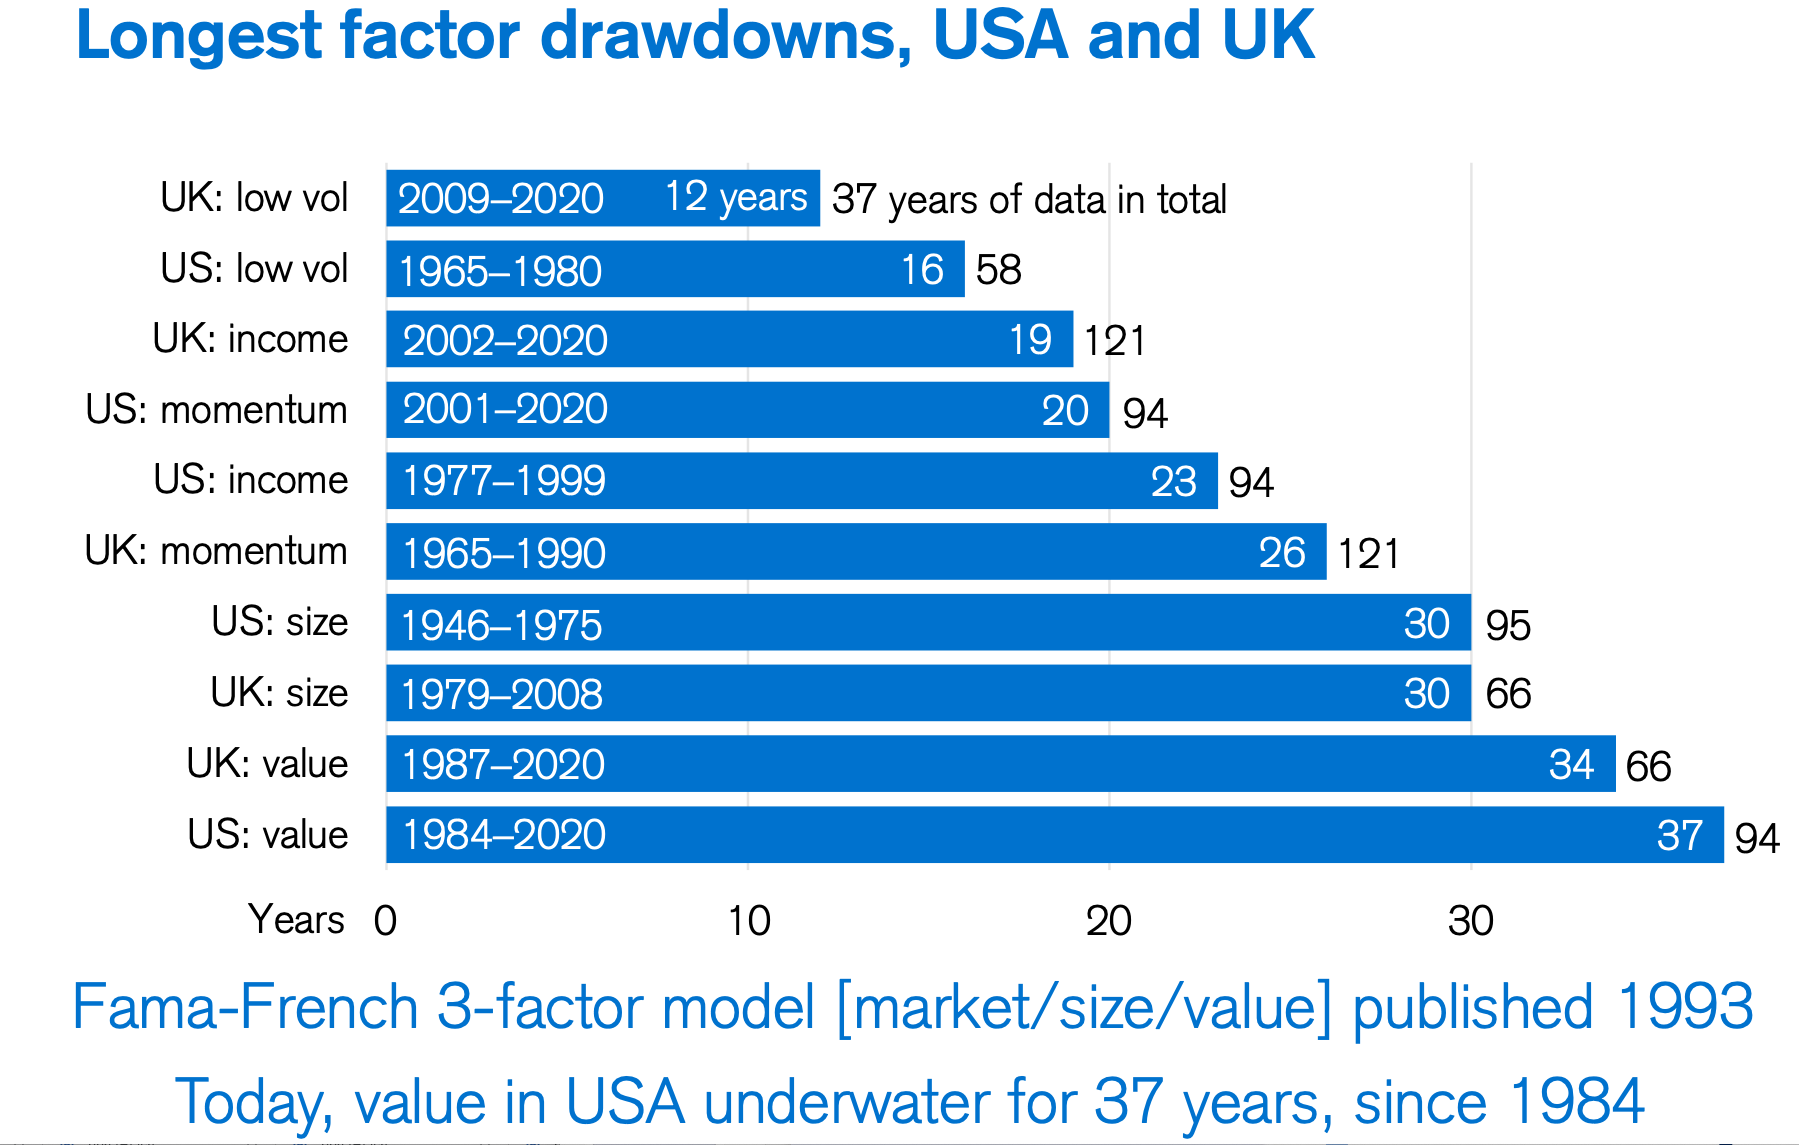 You also have to beware of unexpected effects at big turning points. A perceived shift toward reflation is good for value. But it's even better for some other factors. The following chart shows the performance of a range of U.S. factors during February, as measured by Andrew Lapthorne of Societe Generale SA: 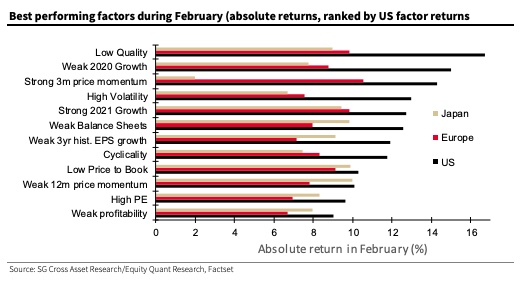 Low quality — companies with terrible balance sheets — did best last month, as the risk of widespread insolvencies retreated. Value (low price to book) appears only ninth on Lapthorne's list. Why? Value factors are not necessarily the winners on an absolute basis here. Yes, relatively they will do well as bond-proxies and growth stocks de-rate, but courtesy of the rally seen so far, many recovery names are no longer cheap, or their earnings are still depressed. So, while the low price to book factor is doing well, stocks with high PE s are also doing well, which is why the Value factor is not performing quite as strongly as you might expect.
Whatever is going on at present, don't expect it to play out like a nice straight line on a graph. A Momentum PuzzleFinally, the Dimson/Marsh/Staunton research reveals one fascinating conundrum. It has long been a dirty secret of the asset management industry that the single most effective factor is momentum — the tendency of winning stocks to keep winning, and losing stocks to keep losing. This strategy has occasional drastic reverses, but generally outperforms the market over the long term, and does so more reliably than value. The question is: Where does the momentum factor come from? Value can be explained as an efficient market moving toward mispriced stocks. The same can be said, to a greater or lesser extent, of the other more durable factors that have been identified. But if markets are efficient in any meaningful way, momentum shouldn't work. It appears to be about the dynamics of crowd behavior, or about the flaws in human psychology, rather than rationally correcting prices. The D/M/S research reveals something very interesting to add to this debate: Value works far better in emerging markets than in developed ones; while momentum works inordinately better in developed markets: 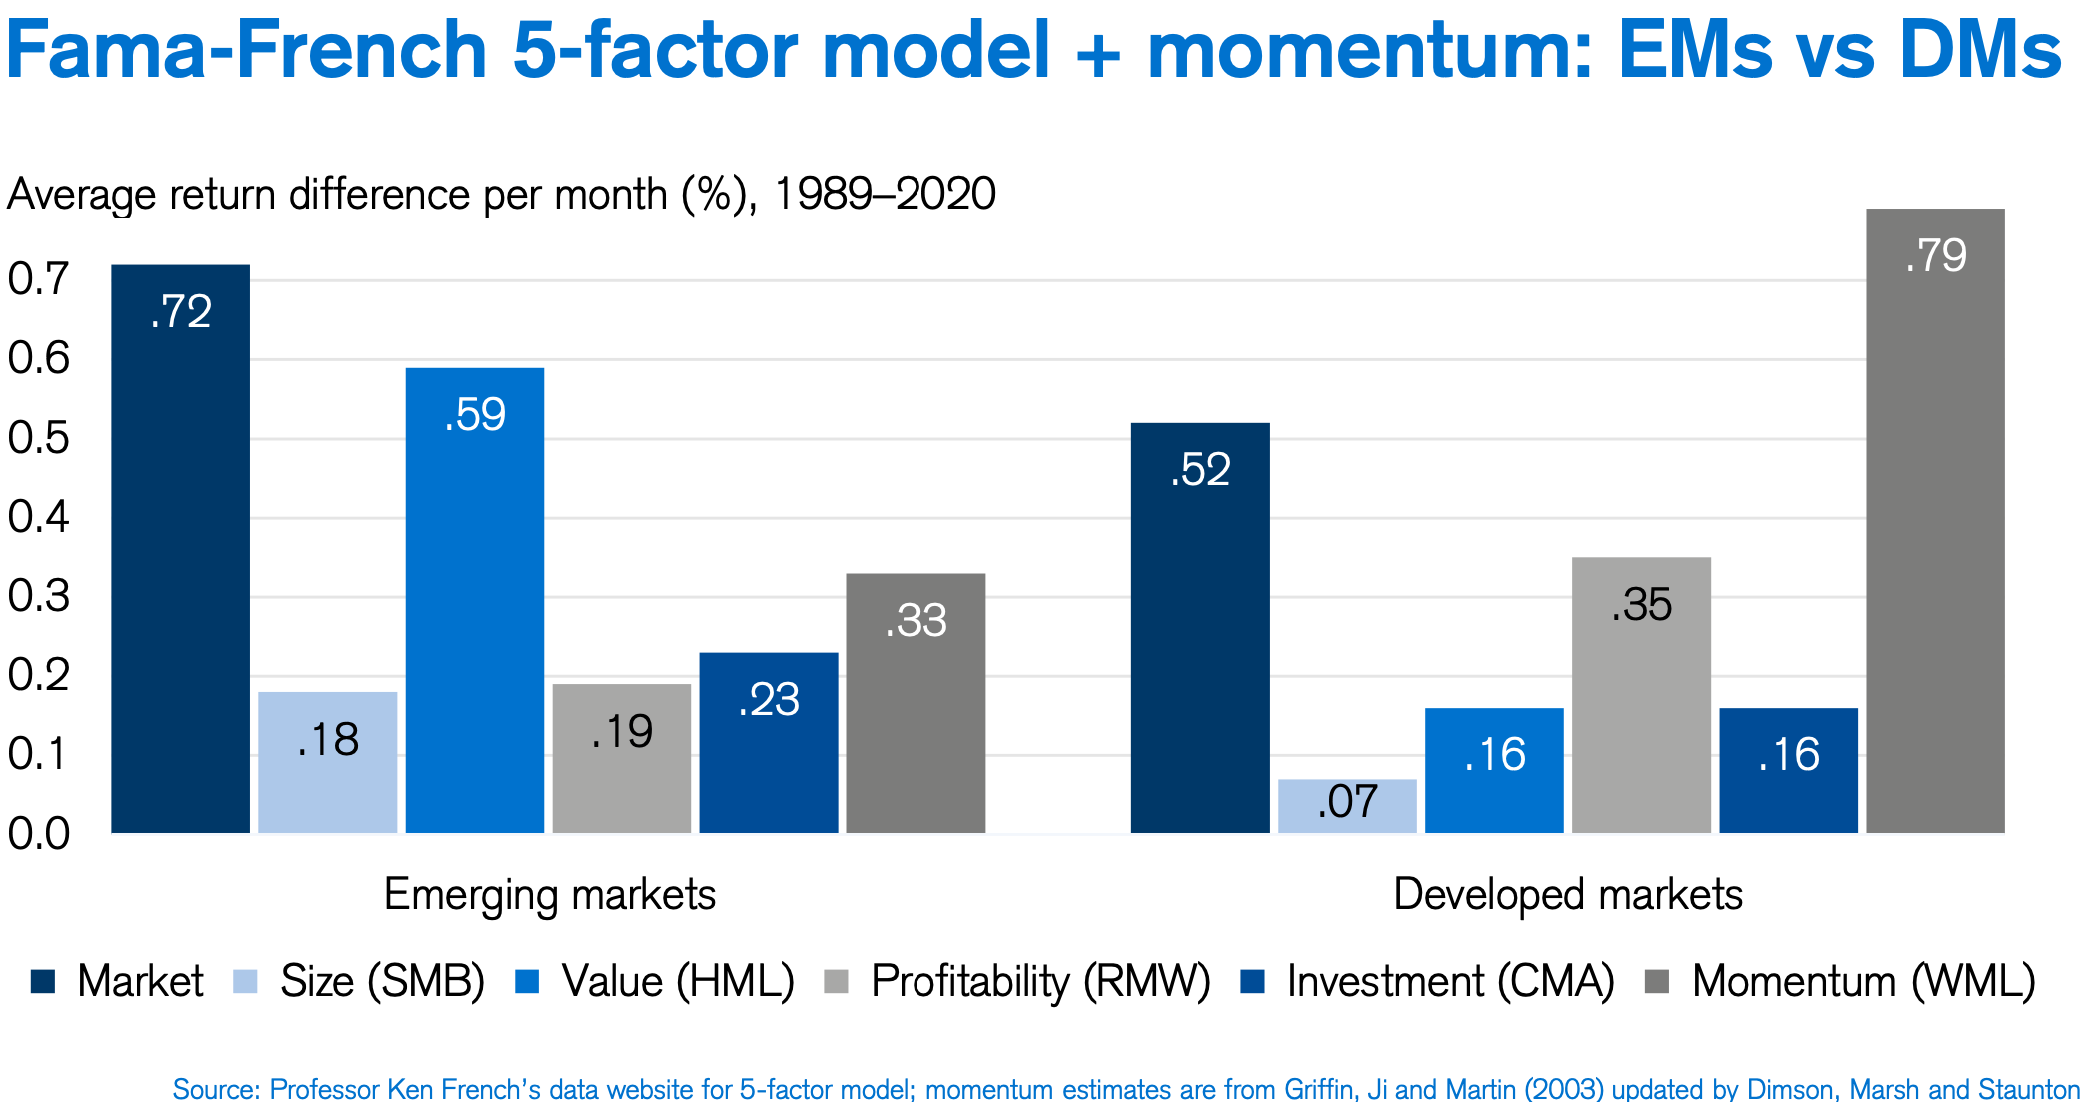 This is really hard to square with the prevailing orthodoxies. After all, emerging markets are so classed in large part because they have less developed market structures, and are therefore prone to be more inefficient. Yet momentum, supposedly a symptom of market inefficiency, works far better in developed markets. The huge variation between different markets is evident from this chart, also from D/M/S, which looks at the momentum factor country by country: 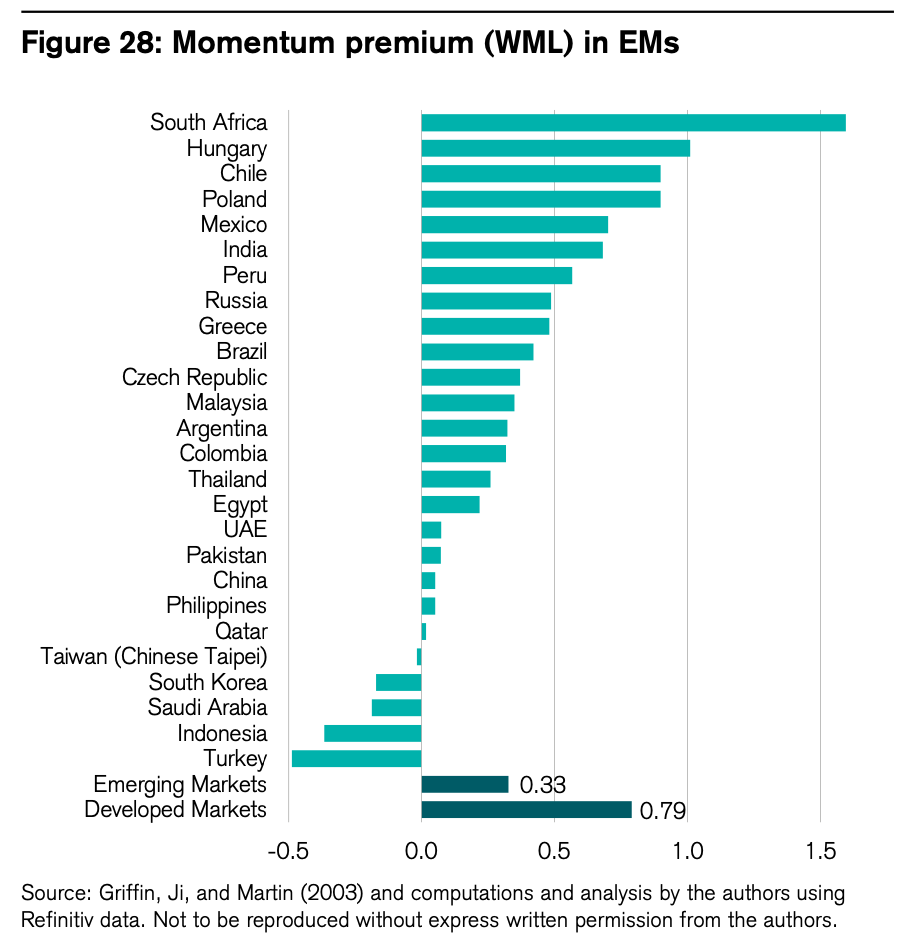 Again, the plot thickens. Two resources-dominated economies, South Africa and Chile, and two former communist eastern European countries, Hungary and Poland, have a momentum effect stronger than for developed markets as a whole — but all others have less. If there is a pattern to this, I cannot discern it. Momentum would appear to be far more prevalent in more developed markets, but it remains hard to see why it is stronger in some emerging economies than others. My own hunch is that momentum may be a function of market institutionalization. Once markets are populated almost entirely by large institutions driven by their own incentives, groupthink takes hold more easily. Being judged against peers, and needing to avoid embarrassing performance relative to their benchmark rather than to get the top possible risk-adjusted dollar for clients, fund managers tend to herd together. In emerging markets, where financial institutions haven't developed to the same extent, this may happen less. This, I must stress, is only a hunch. When I asked Paul Marsh, one of the authors, to explain what was going on, he suggested that the problem with momentum is that "we don't know why it exists, and it shouldn't exist." For anyone wanting to embark on a doctorate in finance, if you have a story that might explain where momentum comes from, that could be a great start for a thesis. Survival TipsMore movie sound tracks. One great sound track I have been missing was The Big Chill, which has a great line-up of 1960s songs, from Procol Harum's Whiter Shade of Pale to You Make Me Feel (Like a Natural Woman by the late, great Aretha Franklin. Also deserving a mention is Four Weddings and a Funeral, which the family watched this weekend, and which should definitely have been somewhere high in my listing of rom-coms. The single most memorable moment in this very good movie, which prevents it from becoming a hopelessly over-romantic meringue, is John Hannah's recitation of W.H. Auden's Funeral Blues.
Finally, I should also have given more of an honorable mention to David Lynch's Wild at Heart. Beyond being impossibly cool, and featuring Chris Isaak's Wicked Game to accompany the young Nicolas Cage and Laura Dern, the sound track also somewhat incongruously includes Im Abendrot from Richard Strauss's Four Last Songs. It's possibly my mother's favorite piece of music, so it brings back memories. And it is rather good. Have a good week. Like Bloomberg's Points of Return? Subscribe for unlimited access to trusted, data-based journalism in 120 countries around the world and gain expert analysis from exclusive daily newsletters, The Bloomberg Open and The Bloomberg Close. | 


Post a Comment