Coronamarkets It is difficult not to think in circles about Covid-19. There is a welter of research out there, very little of it yet subject to intensive peer review. Whatever your initial bias, someone somewhere has research to confirm it. To organize thinking, I would like to highlight just one piece of research — from Andrew Brigden, chief economist of Fathom Financial Consulting in London — that brought together the various strands better than anything I have read so far, or at least organized the problem for asset managers in a very useful way. After crunching through some statistical analysis, Brigden found that the crucial reproduction number, or "R" rate — the number of people infected by each person who has Covid — tends to diminish in line with reduced mobility. In other words, the more people stay at home, the less they infect others. But crucially, R also decreases in line with the number of people who have already been infected. This second variable is plainly very good news. The more any individual country has had the disease already, the slower it is likely to spread. To show the effect, Brigden offered this chart of how much reduced mobility can explain infection rates in the U.K. on its own, compared with the actual change in R that has happened: 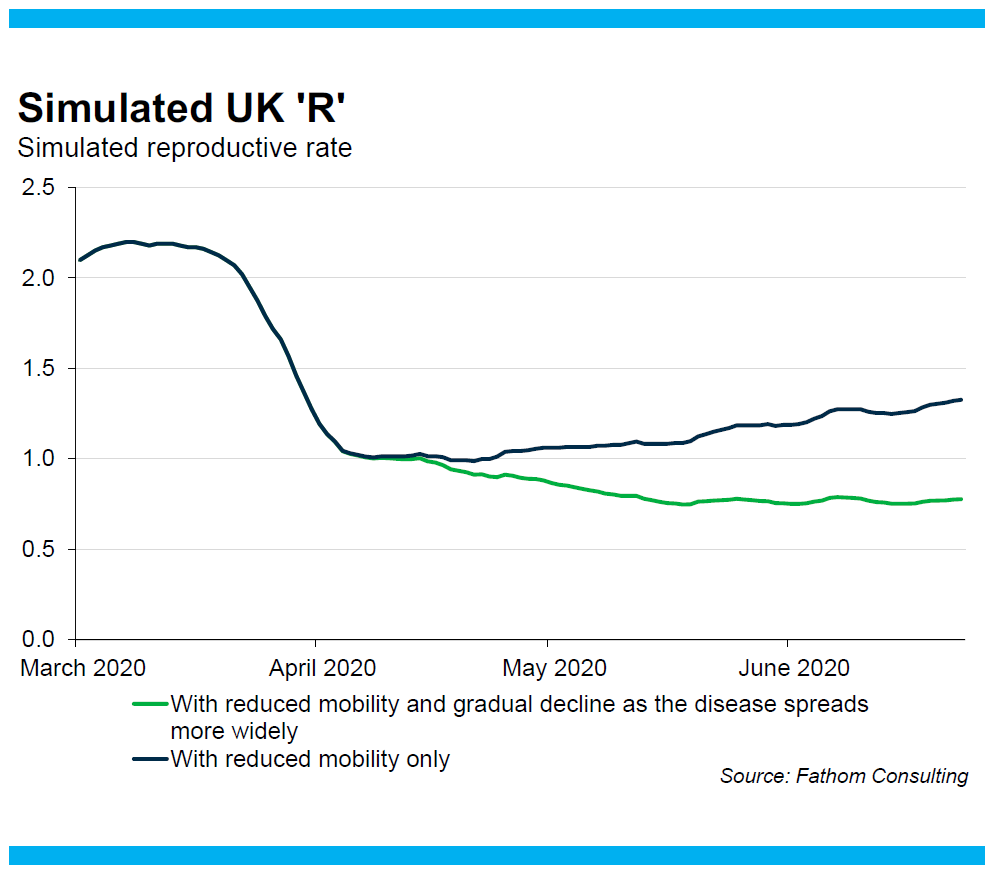 The U.K.'s drastic lockdown in March and April plainly had everything to do with bringing spread under control. But we would have expected infection rates to drift upwards as the country began slowly to return to normal in the late spring; instead, the R rate has continued to fall and remains below 1. Naturally, one of the greatest concerns at present centers on the U.S., and the way that Covid is now taking hold across the states of the "Sun Belt" that had largely been spared during the beginning of the outbreak in March. The failure of these states to clamp down on mobility doubtless has much to do with this. But when Brigden mapped R in each state (for these purposes, simply looking at the multiple of new cases this week compared to last), against the death rate that it had already suffered, there was a clear and strong relationship. States with minimal death rates so far are suffering serious levels of R well above 2. The states that have suffered the greatest death tolls to date, which are all now well into their reopenings, still have R rates comfortably below 1: 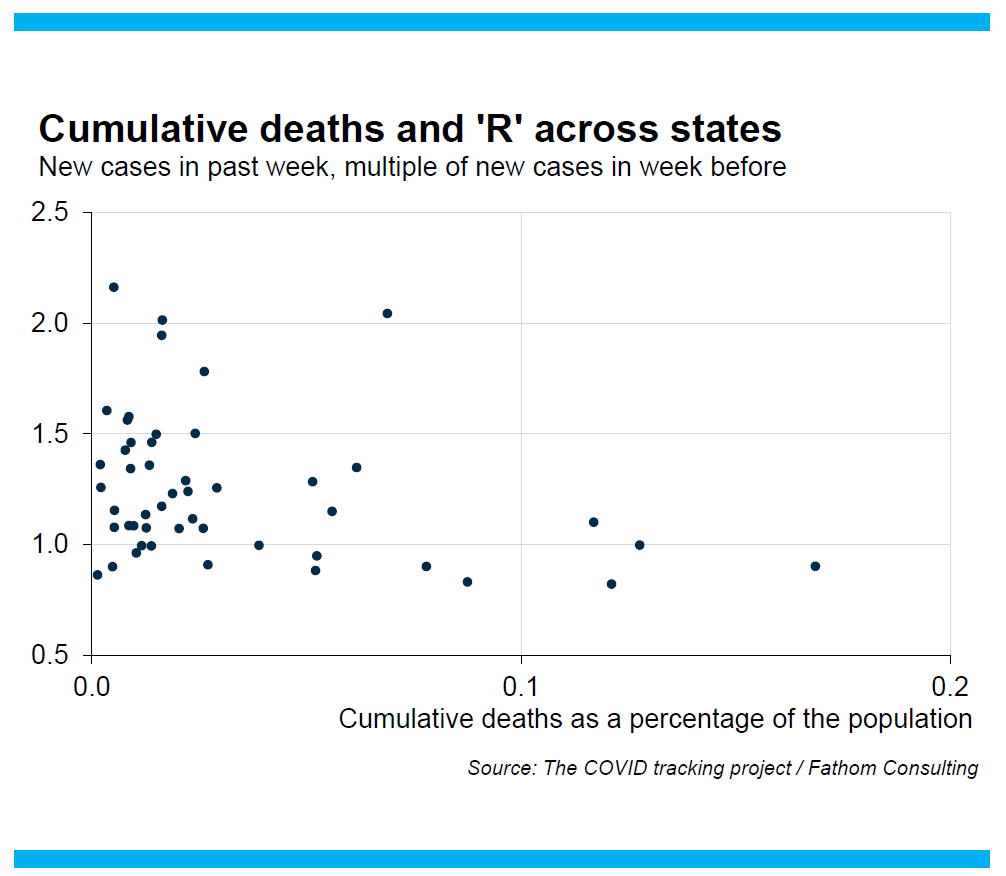 What is going on? Brigden very usefully breaks down the possibilities into five broad answers, which are not mutually exclusive. The first three, I would say, are unambiguously positive, both for us all as humans, and less importantly in terms of the prospects for risk assets. The fourth is somewhat negative, but still suggests that there is a clear if costly way to keep the damage wrought by the virus under control. The fifth would be a total nightmare: - Fear of dying from the disease provokes other changes in behavior, such as more frequent hand washing and the wearing of face masks, that prevent the spread of the disease but are not captured by measures of mobility
- Heterogeneity across the population means that we all have a different 'R' number, with some people, including those with a large network of contacts, more likely both to acquire the disease and to pass it on. Once those people have been exposed, and are no longer susceptible, the average R will fall
- The virus has spread far more rapidly than antibody testing suggests, which means the virus is running out of people to infect
- Potential 'super spreader' events — such as nightclubs, and music concerts that involve a lot of people being close together indoors — are no longer happening
- It is a seasonal phenomenon in the northern hemisphere, and it will return later this year in a 'second wave'
Living in New York, I see a lot of truth in the first. It is unusual to see people walking down the street unmasked, and more or less every building requires you to wear a mask to enter. I have never yet seen anyone complain about this. As the disease takes hold in the Sun Belt, I suspect strong and understandable resistance to minor inconveniences like mask-wearing will begin to disappear. I can believe that there is a fair amount of truth to the second hypothesis, and the authorities are busily testing the third. In New York in the early days, plenty of people with nasty cases of Covid-19 who did not need to be hospitalized were never tested, and so do not appear in the figures. The fourth makes much sense, and bodes ill for cinemas, theaters, professional conference businesses and sports played indoors as well as nightclubs. It must be miserable news for single people in their twenties. Going without such "super spreading" events would inevitably have a negative ongoing impact on GDP, but it would be well short of a disaster. A true second wave (what is happening in the Sun Belt is a continuation of the first wave that hit the Acela Corridor) would be a disaster. The second wave of the Spanish flu in the fall of 1918 proved far worse than the first wave that spring. As a second wave of Covid-19 would overlap with seasonal flu, and would hit a population very reluctant to return to lockdown, it would be terrible for the world's advanced economies, and quite possibly inflict even more economic damage than the first wave has done. Current events in the Sun Belt, India and Latin America do not disprove that the disease is seasonal. For the time being, it is most prevalent in the southern hemisphere, where it is winter. We have few if any worthwhile precedents, so attempting to measure the risks with precision is futile. Very crudely, let's give each of these five possibilities a 20% chance of being correct. So there's roughly a 60% chance that the countries that have already had a serious outbreak truly have it under control now and that the U.S. will at last subdue it once the Sun Belt surge dies down; a 20% chance that there will be a continuing but manageable economic drag; and a 20% chance that the worst is yet to come. Anyone whose portfolio is substantially under-exposed to the chance of continuing growth in assets, or fails to hedge againstthe very significant tail risk that still exists, should probably make some changes. In Case You Missed It ... In case you missed it, I took last week off. So here is a quick guide to what I missed. First, and perhaps most important, the fall in real yields continues. The real 10-year Treasury yield is reaching ever closer to its pre-taper tantrum low: 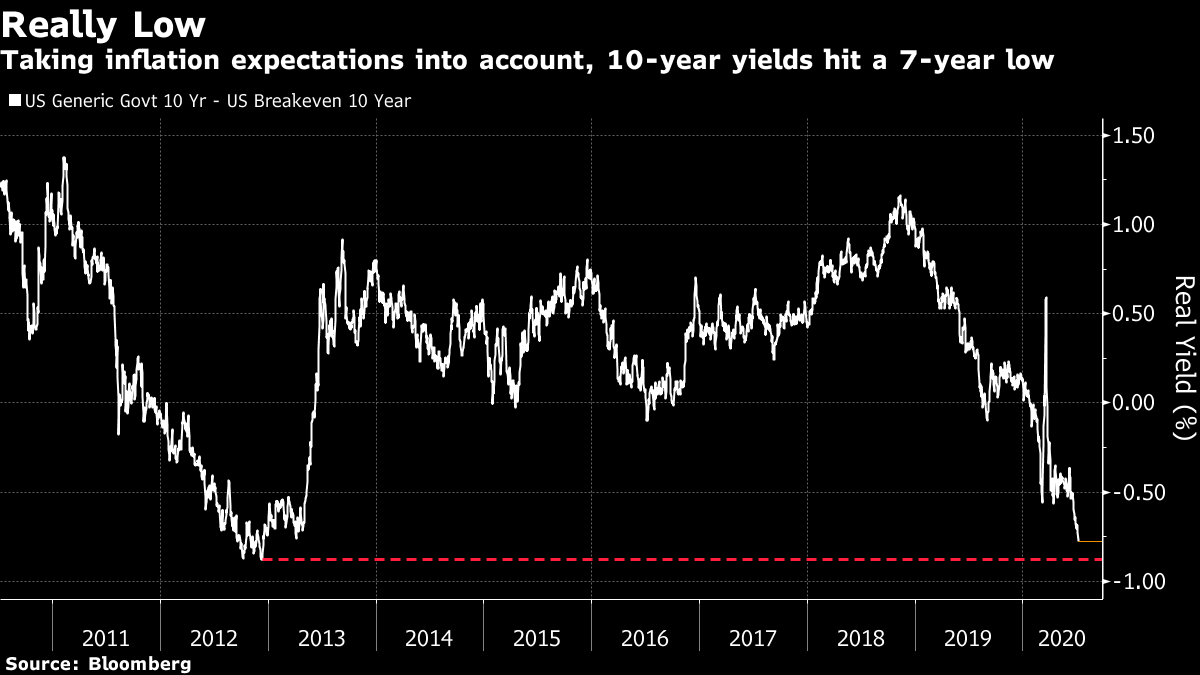 This is largely because yield curve control (or YCC — the policy by central banks of targeting a particular yield for longer-dated bonds rather than just operating on short-term money market rates) appears already to be in effect. Or at least, the market is behaving as though it is. The steadiness of nominal yields as inflation breakevens have picked up in recent weeks is remarkable: 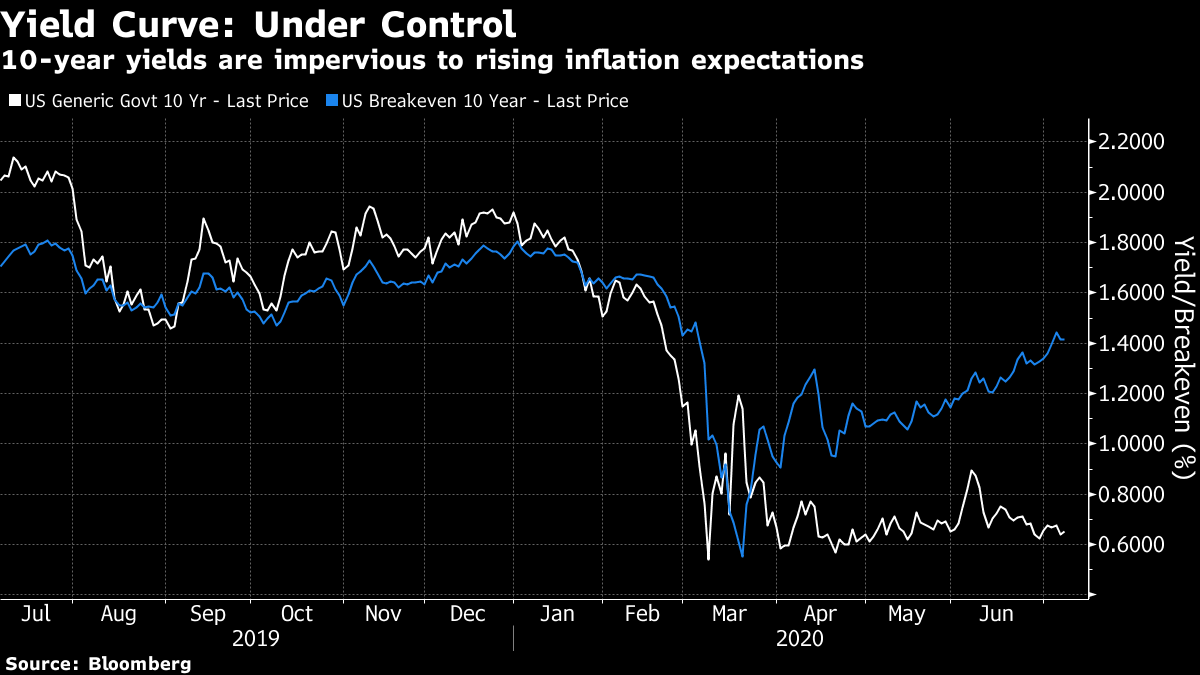 It looks ever more as though the favored Plan A for financing Covid-19 is going to be financial repression, or forcing us all to lend to the government at uneconomic rates. That was also the plan after World War II, although arguably there was rather more in the way of impetus for economic growth back then. If true, then that should be good news for currencies other than the dollar (especially those in emerging markets), as lower U.S. yields weaken the American currency, and for risk assets in general. It is particularly good news for the gold price, which tends to move in tandem with real yields, and which on Tuesday hit its highest since 2011: 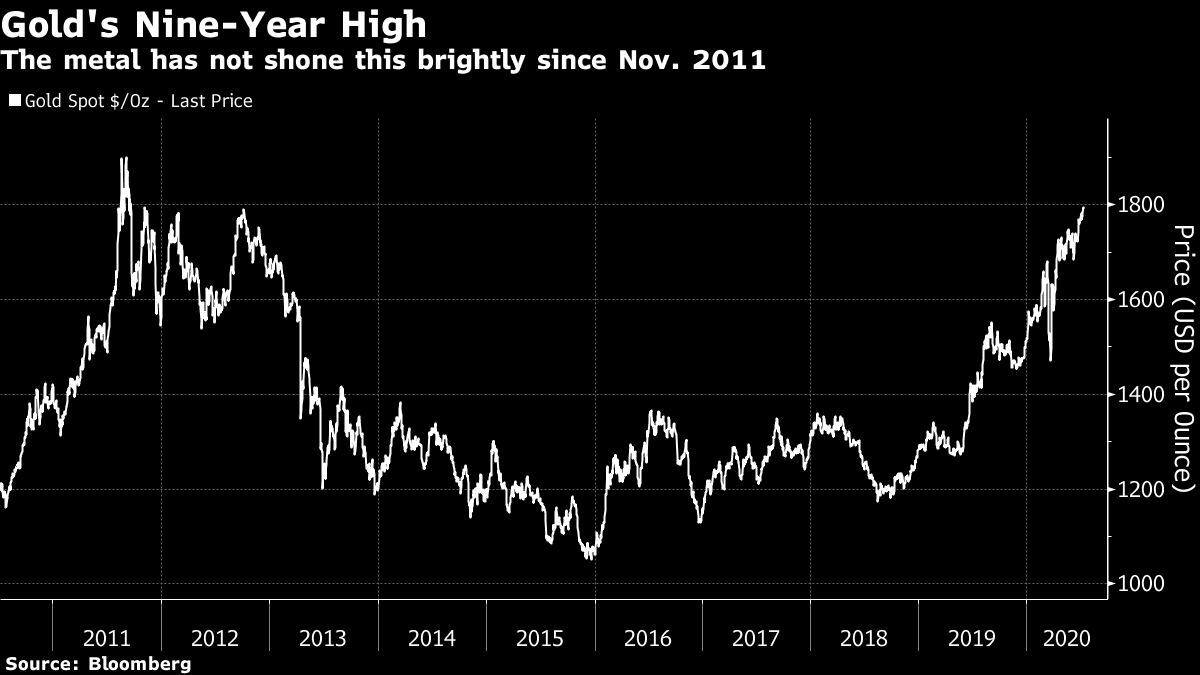 Another support for risk assets comes from the economic data which, in the U.S., have been startlingly good. A string of positive surprises from the labor market was followed at the beginning of this week by sharply improved services ISM data, which suggest that problems are at an end. The data of the last month have helped to take Citigroup Inc.'s economic surprise index for the U.S., which rises when data exceed forecasts and falls when they disappoint, to by far the highest level since inception in 2003. The U.S. data are almost literally off the charts. China, the euro zone and the world in general have also seen rebounds from extremes of pessimism, but the U.S. truly stands alone: 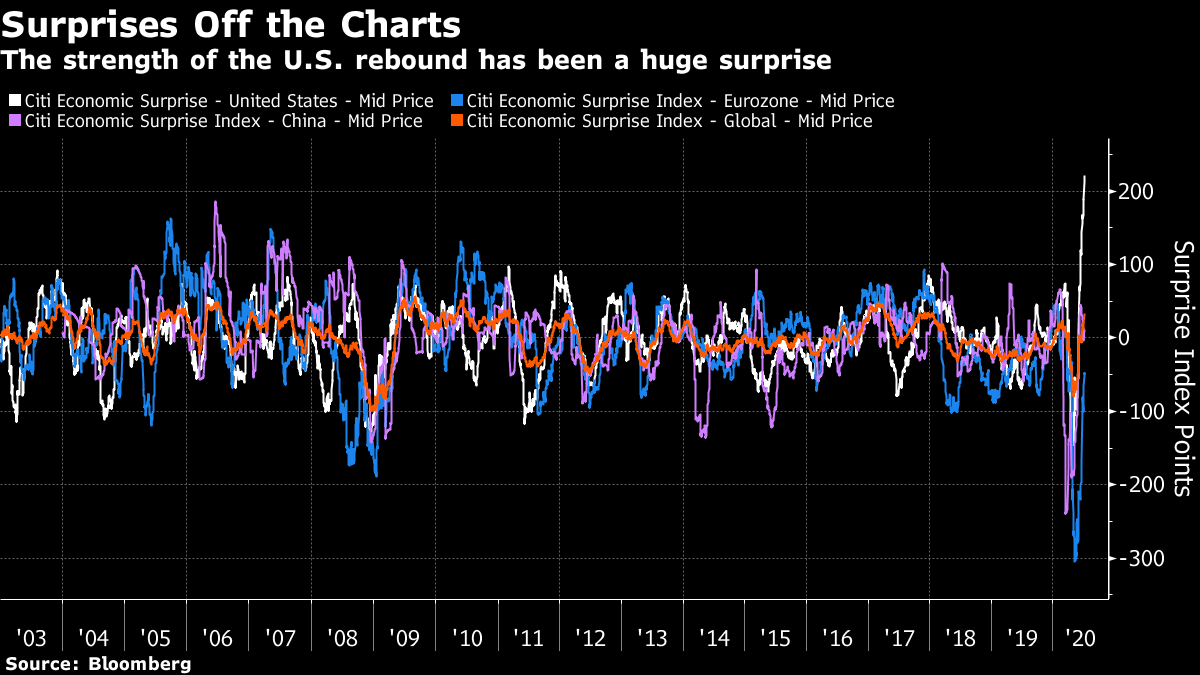 This has much to do with the role of Covid-19 in scrambling economic models and making any predictions harder. But data also come with an built-in lag, and so do not include the outcomes of the last few weeks, as a number of Sun Belt states have started to retreat from previous reopenings for normal business. It is possible that the extreme surprise for the U.S., compared to other countries that have been more successful to date in dealing with the virus, reflects the fact that the attempt to return to normal came far earlier than anyone could have had reason to expect. If we look at the stock market, we can see fears about a too-early reopening appear about a month ago. Back in March, I started looking at a "Coronavirus Fear" index, of the relative performance of the S&P 500 food retailing sub-index, relative to the hotels and cruise lines sub-index. The idea is that these sectors home in on the companies that are most directly affected in real time by the virus. And after very steady recovery, it does look as though Coronavirus Fear is seeping back in, even as the overall market recovers. Food retailers steadily declined relative to hotels until June 8, but have regained ground ever since:  Meanwhile, despite the strength of the economic data, the broader market continues to look ever narrower, and dominated by the largest internet stocks. This is how the tech-heavy NYSE Fang+ index has performed compared to the equal-weighted S&P 500 since its inception in 2014: 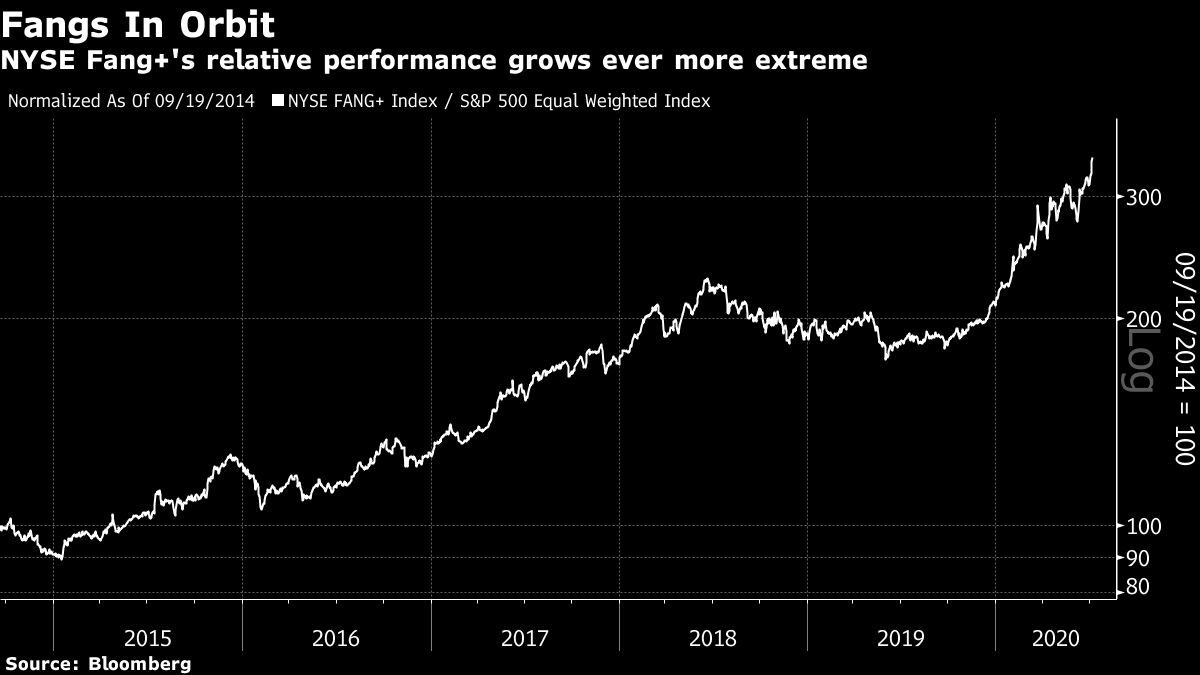 Yes, the so-called "FAANG" stocks are excellent companies, and many benefit from lockdown conditions, as people spend more time online and streaming videos. But the share of the S&P 500 taken by the five biggest companies by market cap (Facebook Inc., Apple Inc., Microsoft Corp., Amazon.com Inc. and Google's holding company Alphabet Inc.), has risen to 22.5%. At the beginning of the year, this number was 16.8%. To buy these "FAMAG" stocks, rather than the rest of the market, is to bet that they can become even more dominant. There are other disquieting signs. For example, value stocks are being thumped by growth stocks once more, having started to outperform in the early part of June when optimism that Covid-19 had been contained in the U.S. was at its peak. Generally, lagging value stocks imply concerns about economic growth. So, despite the remarkably positive data that came out during the week I was away, the market is acting ever more as though it is concerned about a return of Covid-19 in the U.S., and propped up by the intervention of the Federal Reserve. Survival Tips I enjoyed my week off. Swimming in a lake is very good for the soul. And the beaches in Boston's North Shore are also good for your physical and mental health. With all of New York City's pools closed for the duration, it's regrettably necessary to travel quite a long way to enjoy a swim in the open air. If swimming is not an option for you, my other big mental health tip concerns Twitter. I deleted the Twitter app from my phone before leaving, and spent a week without looking at it even once. Twitter is a great service, and for journalists it is close to a necessity — it gives you the news very quickly, and it also enables you to take part in the marketplace of ideas. Unfortunately, it also offers a quick and deep dive into the darkest recesses of the human soul. It is a permanent distraction and shortener of attention spans. It was great to be Twitter-free for a week. I am back to checking Twitter, and tweeting, on my computer, but I think I may not bother reinstalling the app on my phone. That's my survival tip. And if you happened to hurl abuse at me on Twitter last week, I'm not sorry I missed it. Like Bloomberg's Points of Return? Subscribe for unlimited access to trusted, data-based journalism in 120 countries around the world and gain expert analysis from exclusive daily newsletters, The Bloomberg Open and The Bloomberg Close. | 

Post a Comment