The Price of Everything and the Value of Nothing It has been four weeks since protesters in Minneapolis burned down a police station in reaction against the killing of George Floyd by police. These have seen remarkable drama on the streets and an impassioned debate in the U.S. and throughout the Western world about racism and justice. But those 20 trading days have seen an almost total lack of excitement in markets. Both the S&P 500 and long Treasury bonds are almost exactly where they were on the morning of May 28: 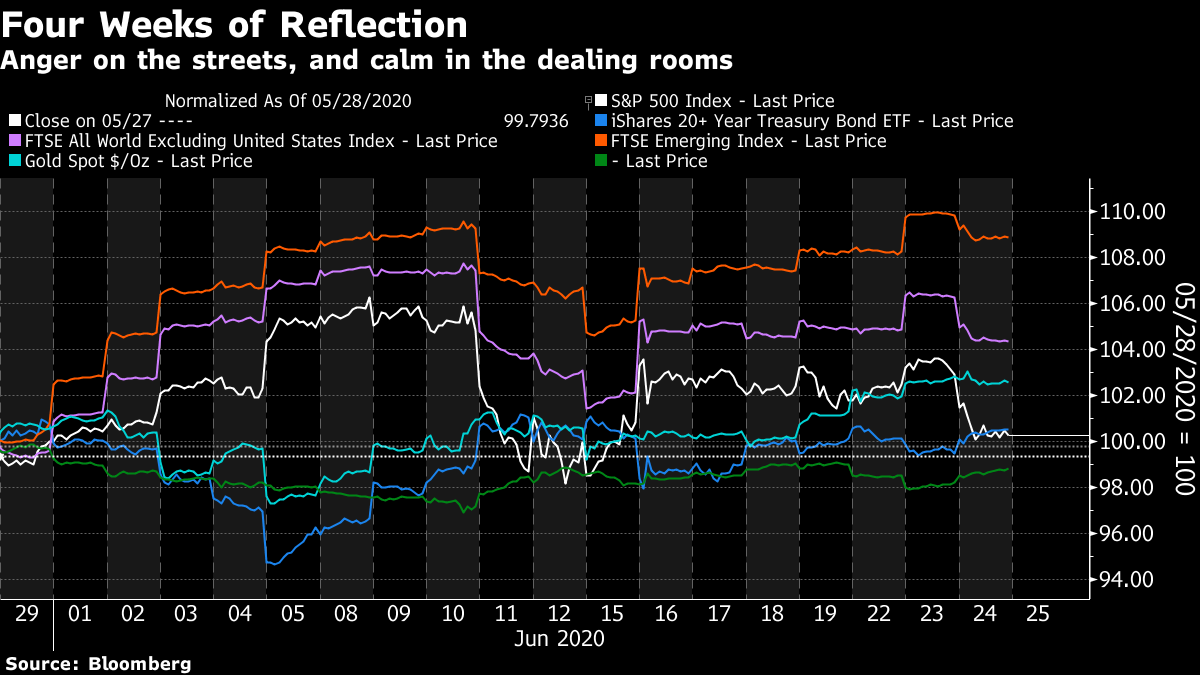 The last month has seen stocks outside the U.S. and particularly in emerging markets gain a little, largely thanks to a slight weakening in the dollar. Gold has gained a bit. As far as it goes, this is healthy. After what was by some measures the fastest stock market rally in history, a period of consolidation is welcome. It also offers a chance to work out whether the market has come too far, too fast. Valuation, it is always necessary to say, doesn't help with timing. An expensive market can always grow more expensive. But it is hugely helpful when allocating capital for the long haul. Over 10 years, the forces of mean reversion tend to mean that investments that were more expensive when you bought them will do worse than investments that were cheaper. According to the investment strategy group at Goldman Sachs Group Inc., headed by Sharmin Mossavar-Rahmani, U.S. stocks don't look particularly expensive, and so there is no need to be underweight in them. As this chart shows, on a series of long-term valuation metrics, current valuations are only slightly higher than the median since World War II, and well below their peak from the top of the dotcom bubble in 2000: 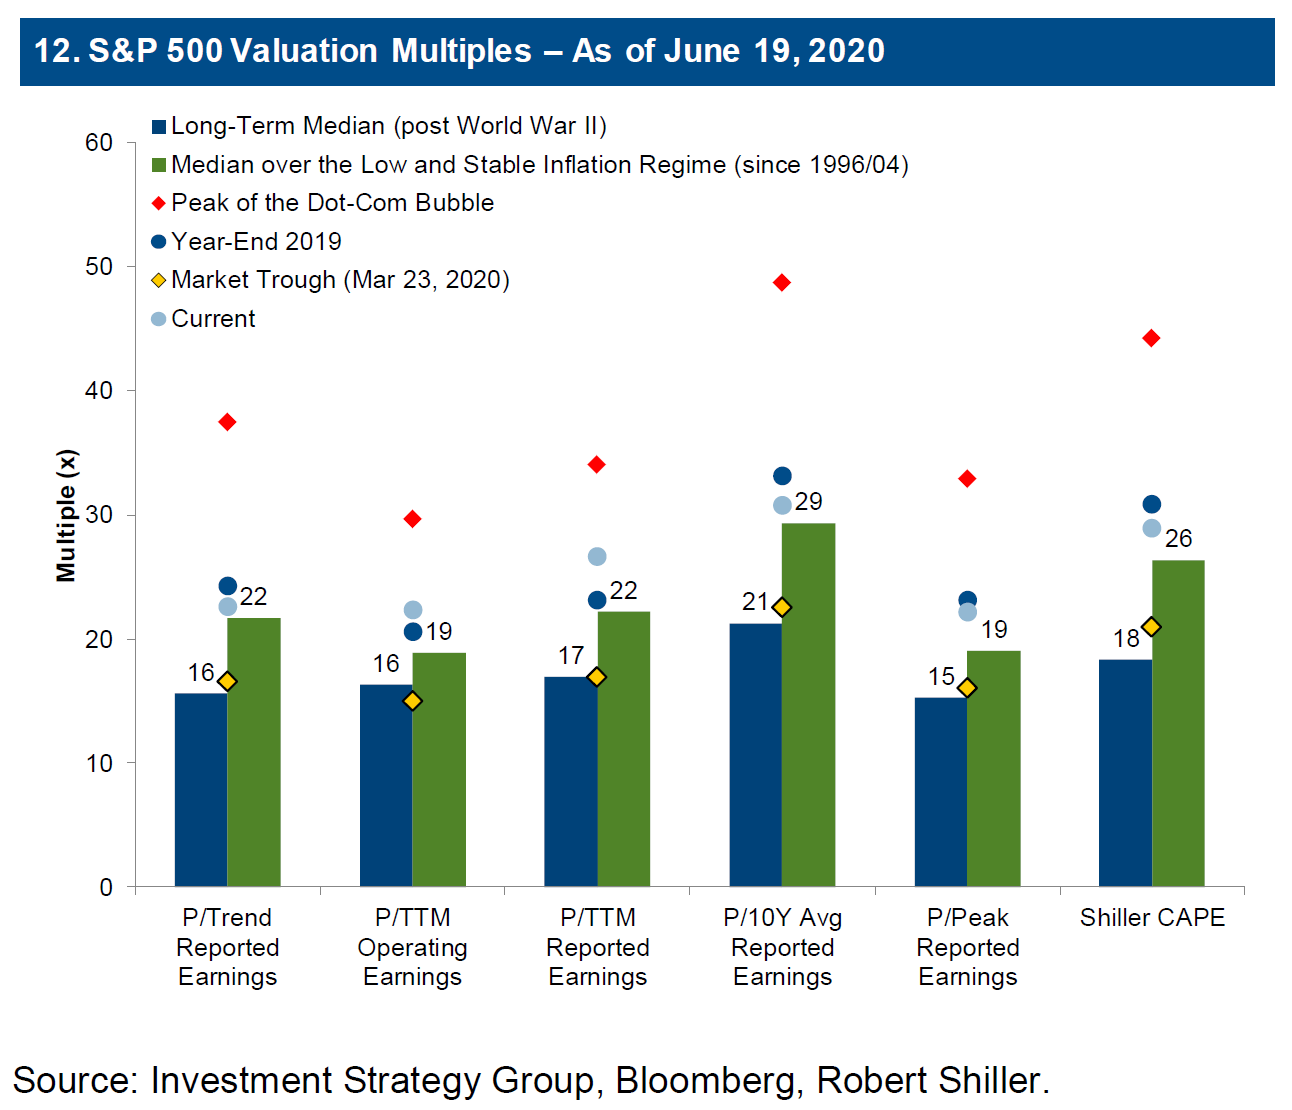 Further, if we use the classic "Fed Model" of comparing the earnings yield (the inverse of the price-earnings ratio) to the yield on 10-year Treasuries, we again find that the S&P 500 looks cheaper than it has done for most of the time since 1996, having looked very inexpensive at the market trough in March. (Note, however, that this period starts at a point when Alan Greenspan, armed in part with valuation ideas from the Fed Model, was already warning of "irrational exuberance.") 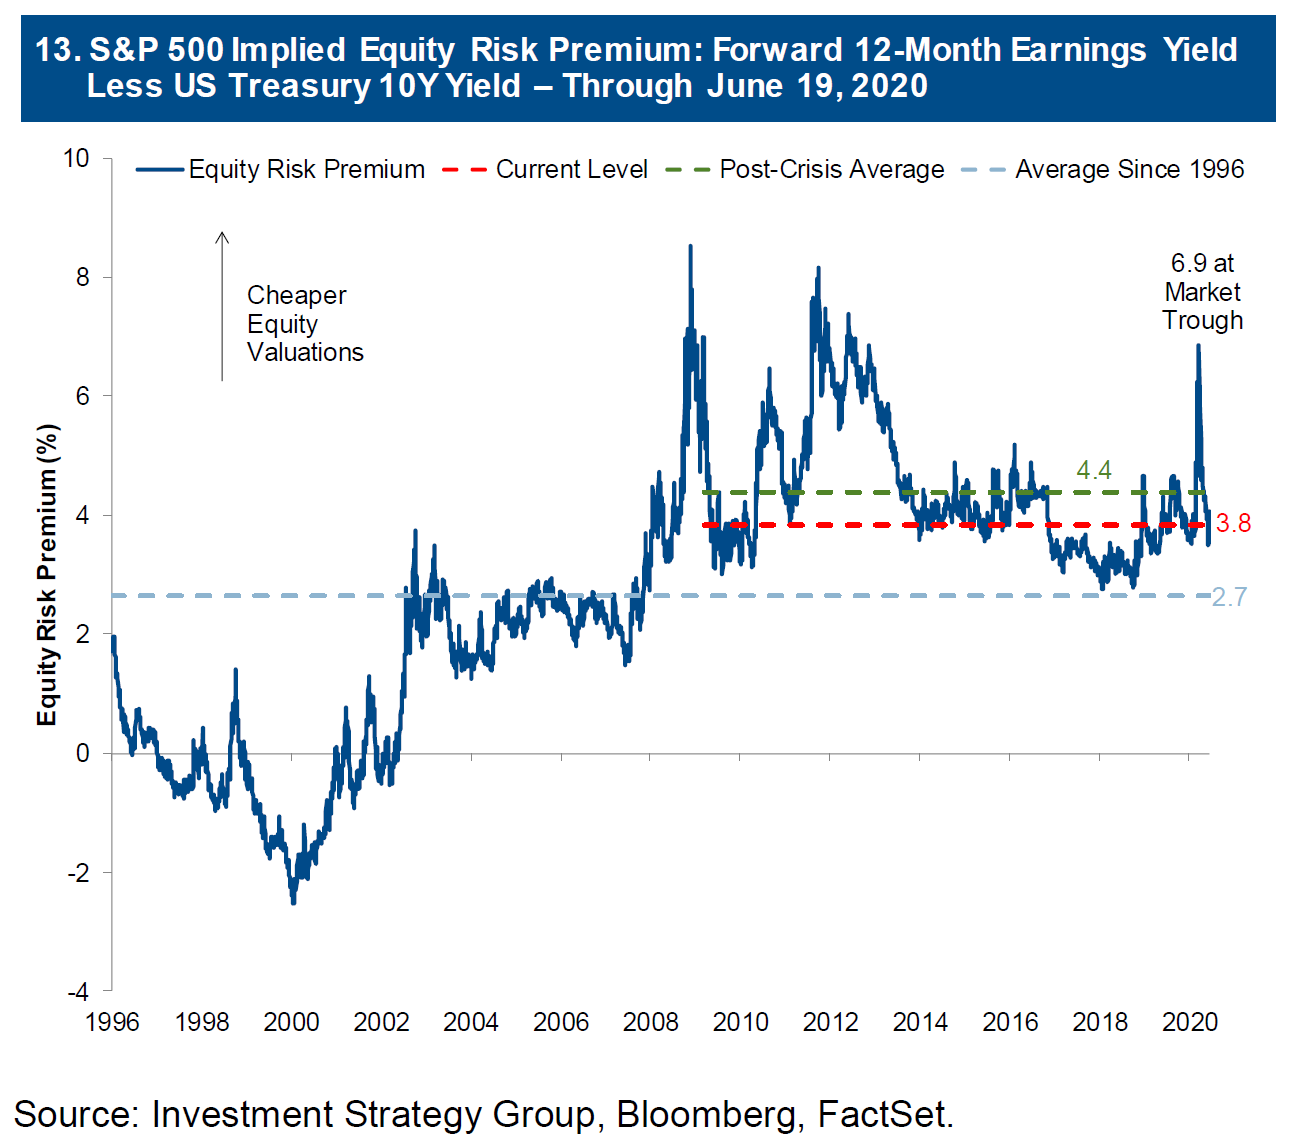 When it comes to the complaint that the recovery has been unbalanced and dominated by big tech companies, particularly the "Fang" internet groups, Goldman shows that the rebound has been strong across a range of sectors. The S&P has jumped even if information technology stocks or Fangs are excluded; and the Russell 2000 smaller companies have actually gained more than the S&P: 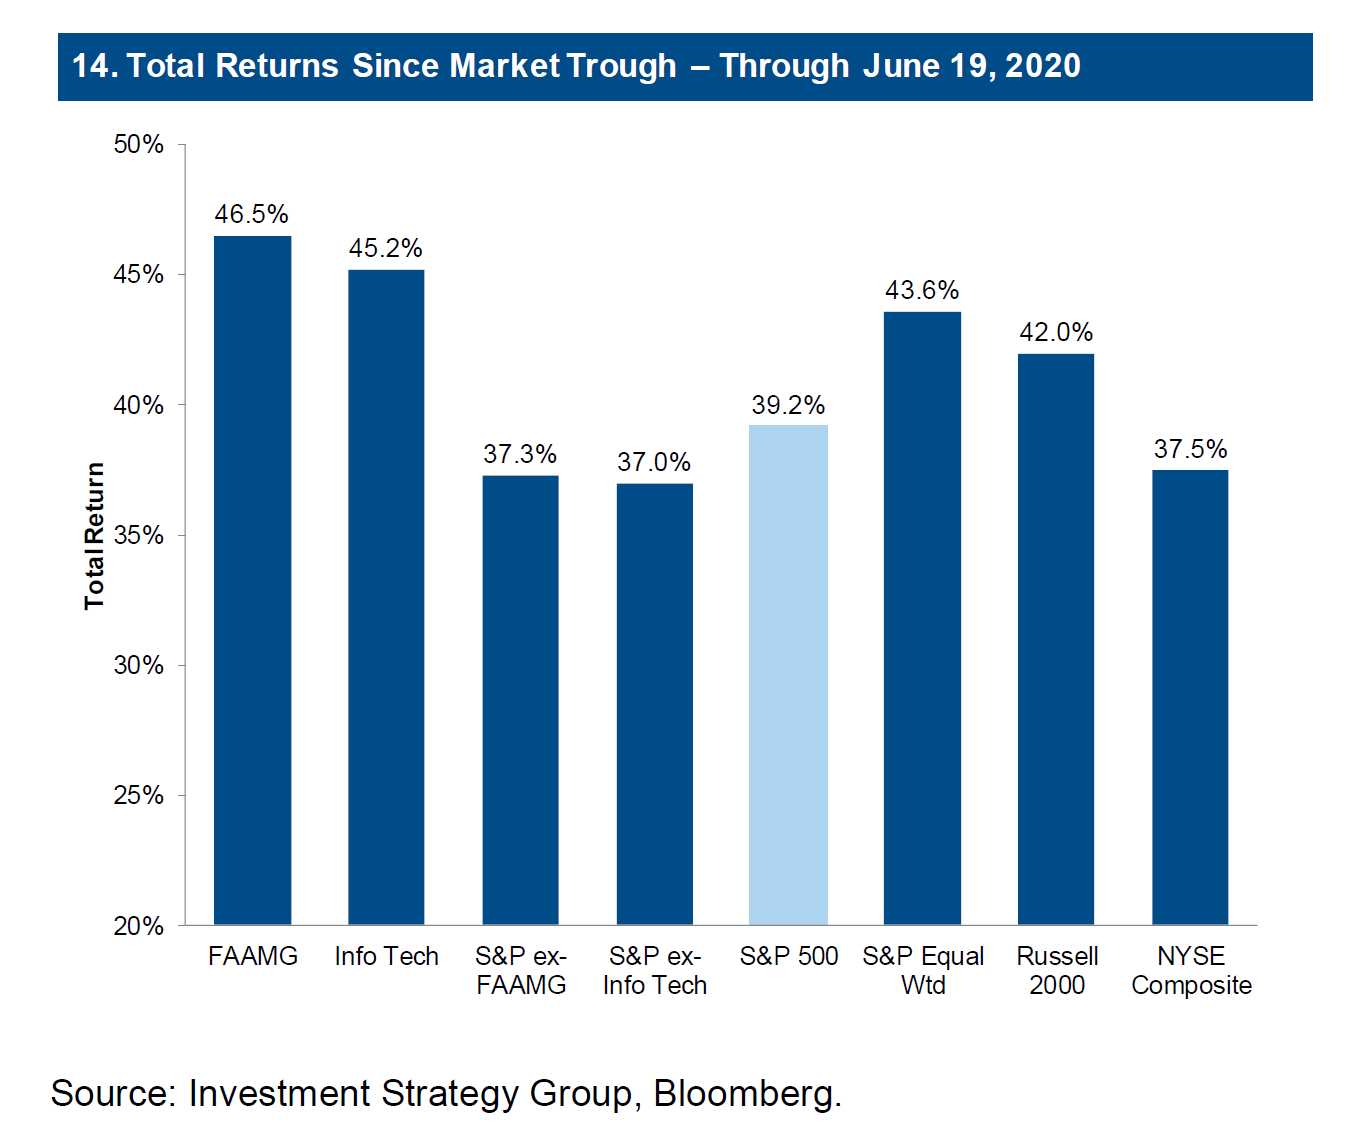 All of these points are well taken. However, it makes most sense to look back to the pre-Covid peak on Feb. 19. Since then, the non-tech sectors sold off more initially, and then recovered less convincingly, so that the final result is that they are lagging badly, even if their percentage recoveries from a low base haven't been so bad: 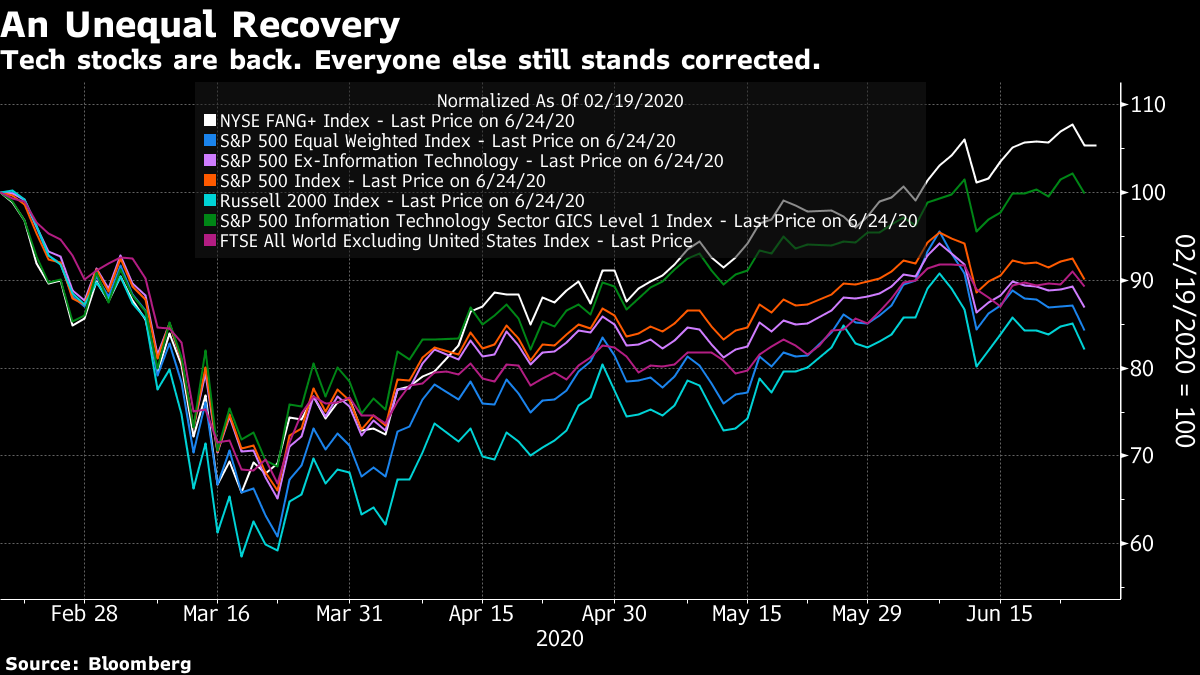 Now we come to the issue of valuation. As the Goldman chart suggested, it doesn't necessarily make sense to look at how expensive stocks are in their own right. Different stocks and indexes may for good reason have a higher earnings multiple than others. A company as profitable as Apple Inc. should probably trade at a higher multiple. Indexes devoid of such companies, such as many European markets, will appear "cheaper" without necessarily offering better value. But if we compare the valuation of markets to their own history, we can get a good rough idea of how expensive they are. In the following chart, from the Research Affiliates asset allocation site (which you might need to expand in order to see properly) countries are ranked by the percentage of the time their stock markets have been cheaper than they are now, when measured by the cyclically adjusted price/earnings multiple made famous by Yale University's Robert Shiller. U.S. large-caps aren't at the top of their range, but they are the only country where valuations are significantly above average. They have been cheaper than this more than 90% of the time. Meanwhile there are four countries, according to Research Affiliates' numbers, where stocks have been more expensive than they are now for 99% of the time. These are Malaysia, Poland, South Korea and Turkey: 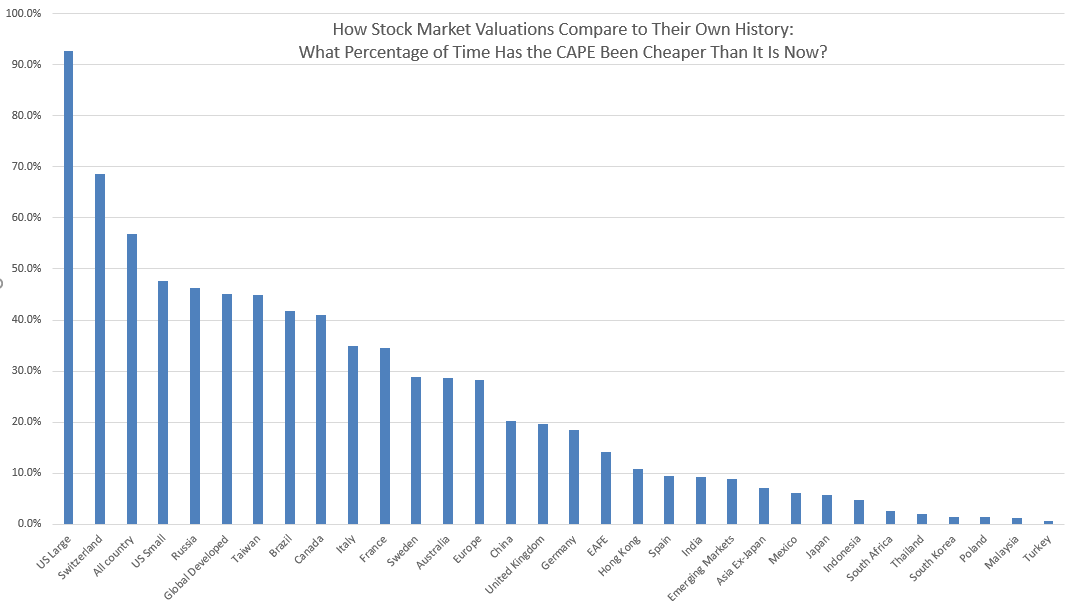 To look at this over time, here is the price to 10-year moving average earnings (a simpler version of the Shiller multiple) multiple for the main stock market indices of these four countries, compared to the same measure for the Russell Top 50 index of the largest U..S companies. The contrast is extraordinary: 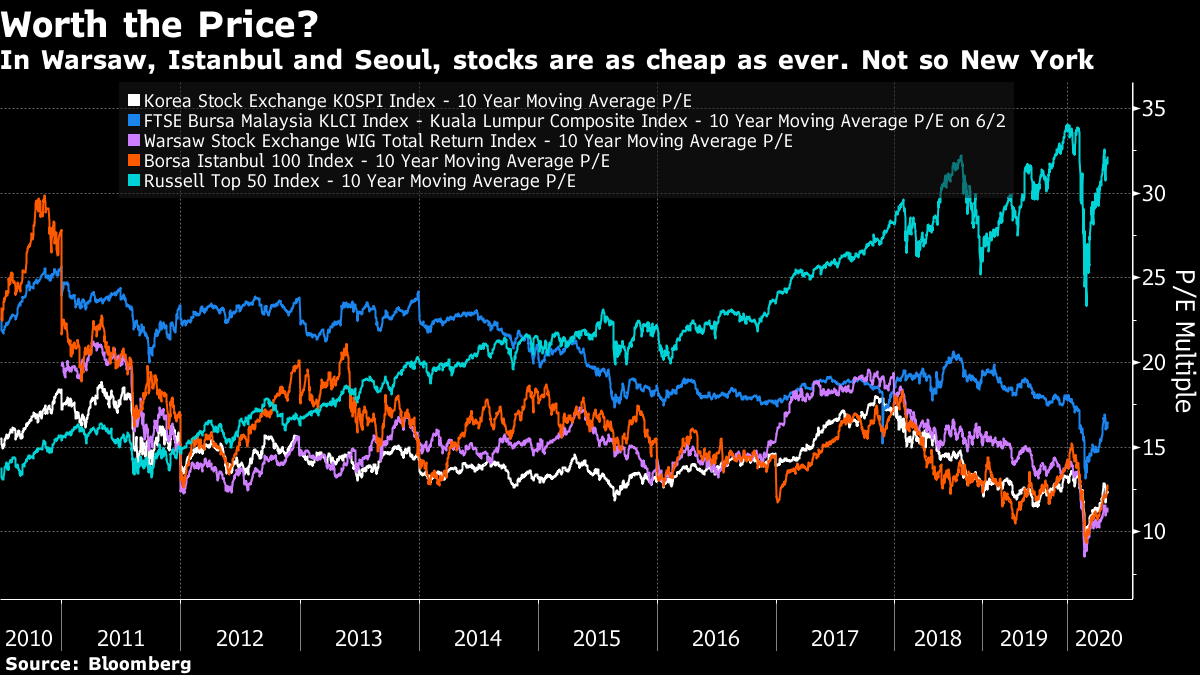 A decade ago, U.S. mega-caps were cheaper than any of these four emerging markets. In hindsight, that was a sign that they would prove to be a great investment. A decade later, the Russell Top 50 is more than twice as expensive as all these other markets. This isn't investment advice. I am not pretending to have done due diligence on Polish or Malaysian stocks. But as Covid-19 is such a big issue at present, it is worth noting that Malaysia and particularly South Korea (with 121 and 281 Covid deaths respectively) have been very successful in the fight against the pandemic, while both Poland (1,396) and Turkey (5,025) have had far greater success in limiting deaths than the U.S. (121,902 at the last count). If fears of the virus and its ongoing impact on economic activity are the main reason to be bearish about stocks at present, it is not clear why the U.S. should be historically expensive, while Korea and Malaysia show up as historically cheap. For anyone interested in trying some active stock-picking, these markets look as though they might be worth some attention. Meanwhile, it is reasonable to argue that the U.S. isn't so overvalued that it should be sold or under-weighted in a hurry. But valuation also suggests that plenty of other countries might warrant an overweight.
Jerome Powell Ate My Homework
Meanwhile, a lot of the surprises of the last few months can be laid at the door of the Federal Reserve, which has reacted far more aggressively to this crisis than to the one 11 years earlier. Three months ago, there was an imminent risk of a liquidity crisis, which the Fed extinguished. This was replaced by concern that we would in due course suffer a solvency crisis, as leveraged companies deprived of cash flow during the Covid-driven slowdown were forced to go bankrupt. There have been some high-profile names to declare bankruptcy, led by Hertz Global Holdings Inc., but as this chart from Credit Suisse Group AG equity strategist Jonathan Golub shows, they so far remain well within the typical range for the post-crisis decade: 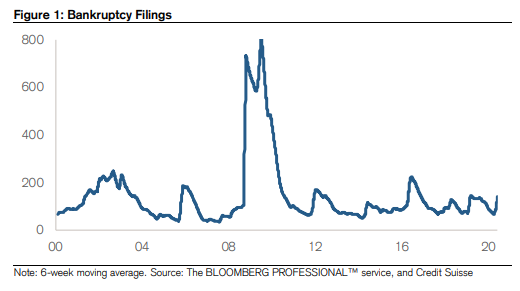 Meanwhile, if we look at the spreads on high-yield debt, we can see that they work well as a leading indicator for bankruptcies, and suggest that bankruptcies will indeed remain contained. Those who positioned themselves for a solvency crisis look as though they will be disappointed (as were those who thought that some Schumpeterian creative destruction might be just what capitalism needed to start generating more benefits for more people): 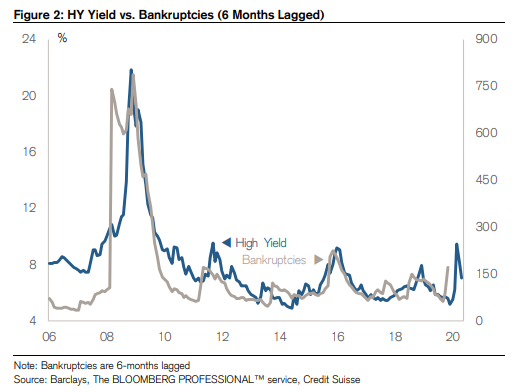 Does this mean nice fat profits for value investors who snapped up stock in companies that appeared to be threatened by bankruptcies? Probably not, and again it is Jay Powell's fault. As this chart from Instinet LLC's quantitative strategist Joseph Mezrich shows, the dispersion of valuations among big U.S. companies has bounded to record levels, and is now even higher than it was in early 2000. The last peak in dispersion proved to be a historically fantastic time to buy value: 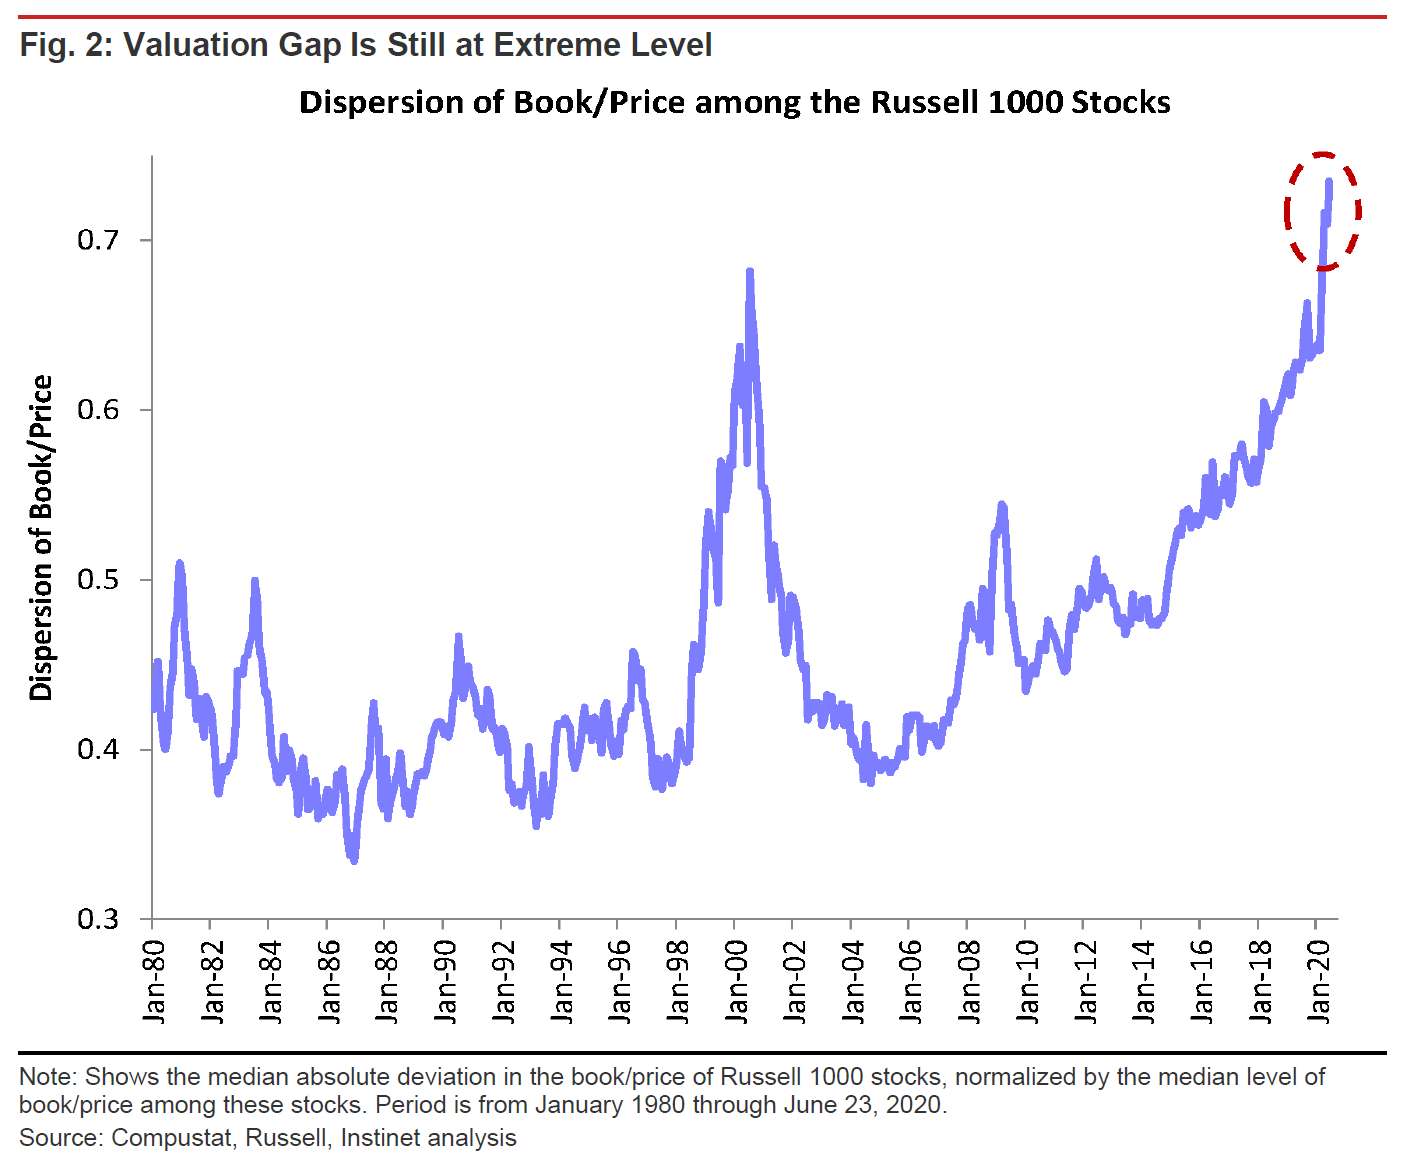 The problem is that value as a style is prone to a flat yield curve. The flatter the curve, all else equal, the poorer will be the performance of cheap stocks. A steeper curve implies greater optimism for the future, and creates the right conditions for value stocks to perform. But the Fed is mulling yield curve control, and the bond market is behaving as though control is already being exerted. Thus, a brief steepening of the curve was followed by fresh Fed announcements, renewed flattening, and the erasure of a brief rise for value stocks: 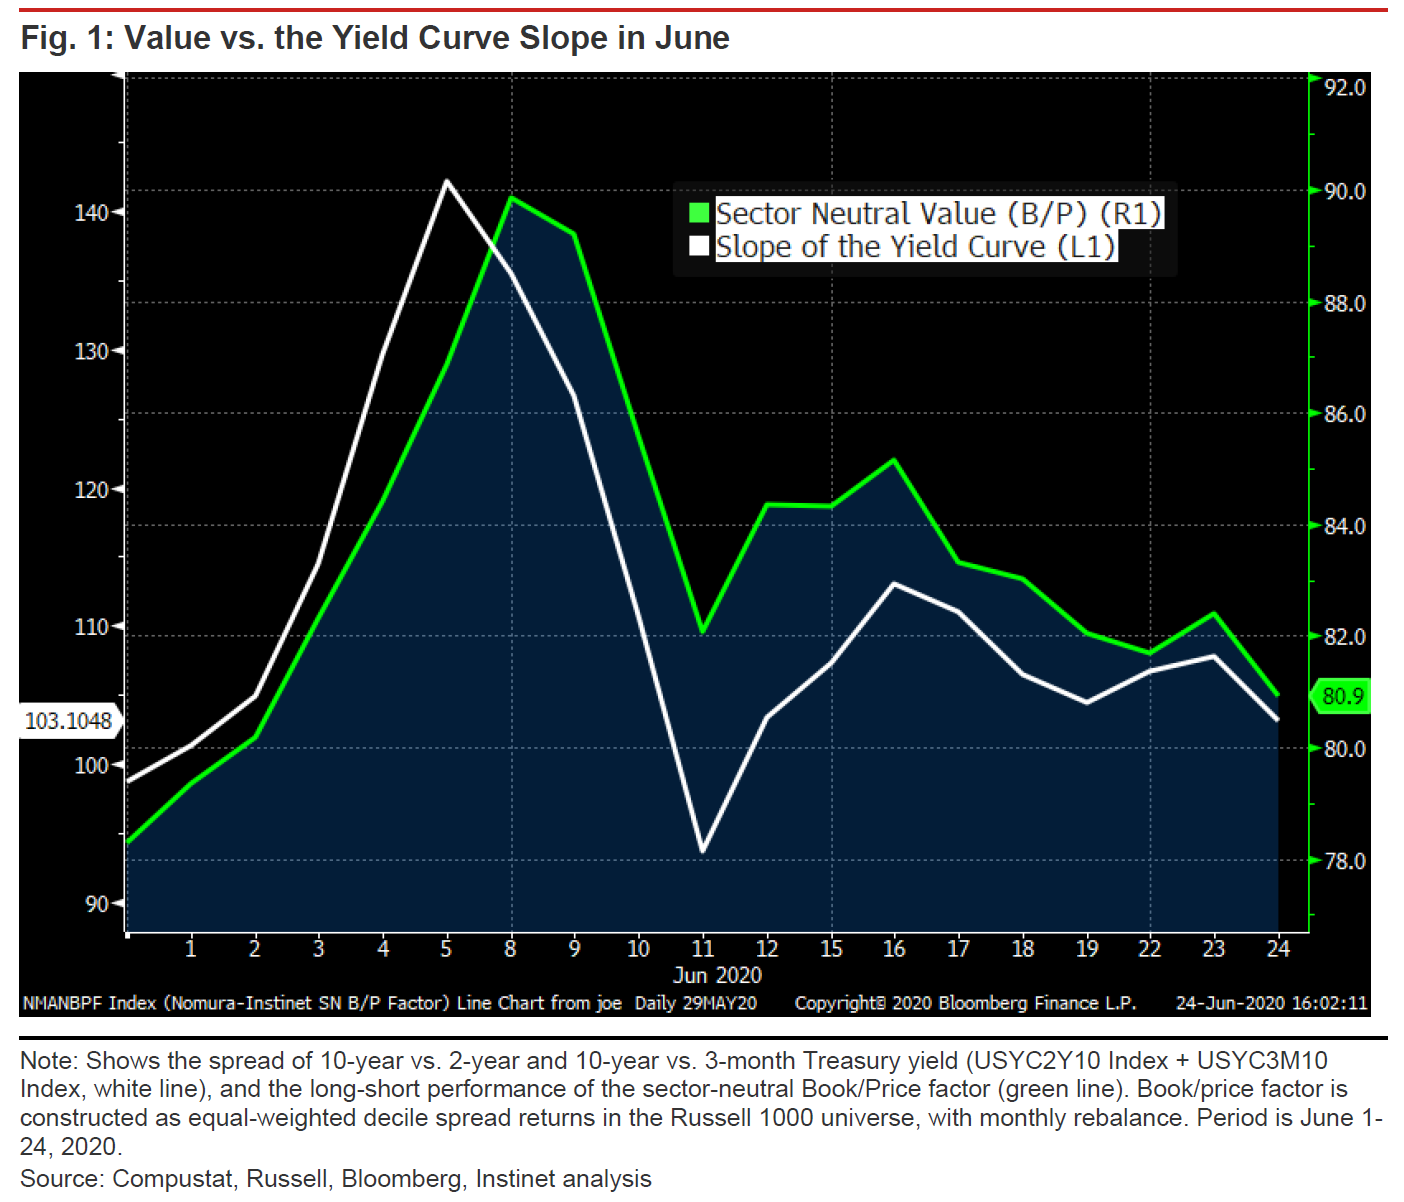 Yield curve control may well be necessary to help the government fund the considerable deficit that it has taken on to bail the economy out. It may well be the least painful remedy open at present. But it will mean continued survival for companies that make poor use of capital, and continuing difficulties for value companies. Markets are making the Faustian economic bargain we have struck with the pandemic ever clearer. Survival Tips Sport is coming back, making it far easier to survive the lack of social interactions that normally make life worth living. Its return brings examples of survival being taken more seriously as a result of the virus. English football with no fans definitely lacks something. But the rules introduced to make the experience less taxing on bodies are, I think, beneficial. Drinks breaks in the middle of each half, because soccer isn't normally played in summer heat, are a healthy development. So is the decision to allow five substitutes, rather than the previous three. Half a century ago, teams had to play the entire game with the 11 players who started. These developments take English soccer in the direction of American sports, with more breaks and more opportunities for coaches to make strategic changes. I can live with that, even if my countrymen can't, and it will be interesting to see how many of the changes survive after the virus. When baseball returns, the National League will finally give up asking its pitchers to bat, and instead call on a designated hitter to take his place. This is a rule that the rival American League has had in place for half a century. While purists will hate that the NL has capitulated, it relieves wear and tear on the pitcher. So will the rule requiring that coaches leave a pitcher in for at least three hitters; not so many pitchers will have to warm up to face only one hitter, games will be shorter, and the wear on pitchers' arms will be less. We also have a new rule where extra innings will always start with a man on second base.
This removes the charming possibility of an interminable game. Two years ago, the Red Sox virtually won the World Series against the Dodgers by forcing the third game to go to 18 innings, using up all the strength in the Los Angeles bullpen. Boston lost that game, but the heroic losing pitcher, Nathan Eovaldi, was one of the heroes of the series, in which the Red Sox didn't lose another game. As a purist, therefore, I am not totally happy. Baseball, oddly, is moving away from the American model of long discontinuous games, as European soccer takes a step toward it. Still, on both sides of the Atlantic, the health of the players should benefit, which is great. And if I have the rhythm of soccer and baseball in the background, working from home will get much easier to survive. Like Bloomberg's Points of Return? Subscribe for unlimited access to trusted, data-based journalism in 120 countries around the world and gain expert analysis from exclusive daily newsletters, The Bloomberg Open and The Bloomberg Close. | 


Thanks for your valuable information. stock investor is a stock related website which provides day to day information of the stock market.
ReplyDeleteMarico Ltd
Torrent Pharmaceuticals Ltd