The Reflex Every little thing the reflex does leaves you answered with a question mark, as someone once said. The last two days have seen an epic rebound for stock markets across the world. In the U.S., it has been the third-best such period since 1945 for the S&P 500, after the two-day rebounds that followed the Black Monday Crash of 1987, and the Lehman Brothers bankruptcy in 2008. That statistic makes clear why we should treat the last two days with caution; bounces on such a scale are only possible if the market has been dropped from a great height. That doesn't mean it can be dismissed altogether. For U.S. stocks, this has ended a streak without two positive days going back 32 trading sessions. As this extraordinary chart from Bespoke Investment Group shows, there have only been three longer such runs for the Dow Industrials since the beginning of the 20th century (two in the darkest days of the Great Depression in 1931, and one in early 1984). It was about time this streak came to an end, and it is a great relief that it has done so: 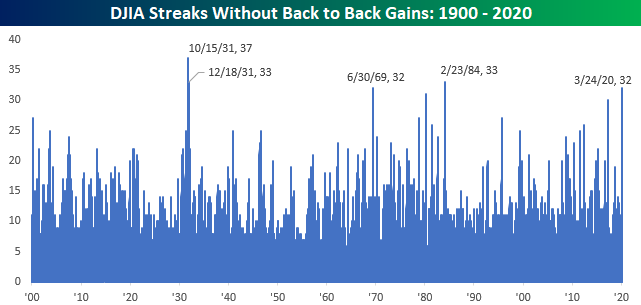 What the last two days do mean, I think, is that the stage of utter panic is over. It is reasonable to expect relatively calmer trading from this point on. That isn't because of any news about the virus, but rather because politicians have avoided a repeat of the 2008 debacle over authorizing the Troubled Asset Relief Program, or TARP, bank rescue package. That shows that at a bare minimum Congress grasps the gravity of the situation, while central banks have done their utmost and appear to be having some effect in thwarting the incipient financial crisis that has been taking shape over the last month. A good way to demonstrate this is the Bloomberg Financial Conditions index, which amalgamates nine different measures. Figures above 0 mean loose conditions, below 0 mean tight. This shows the index over the three decades of its existence: 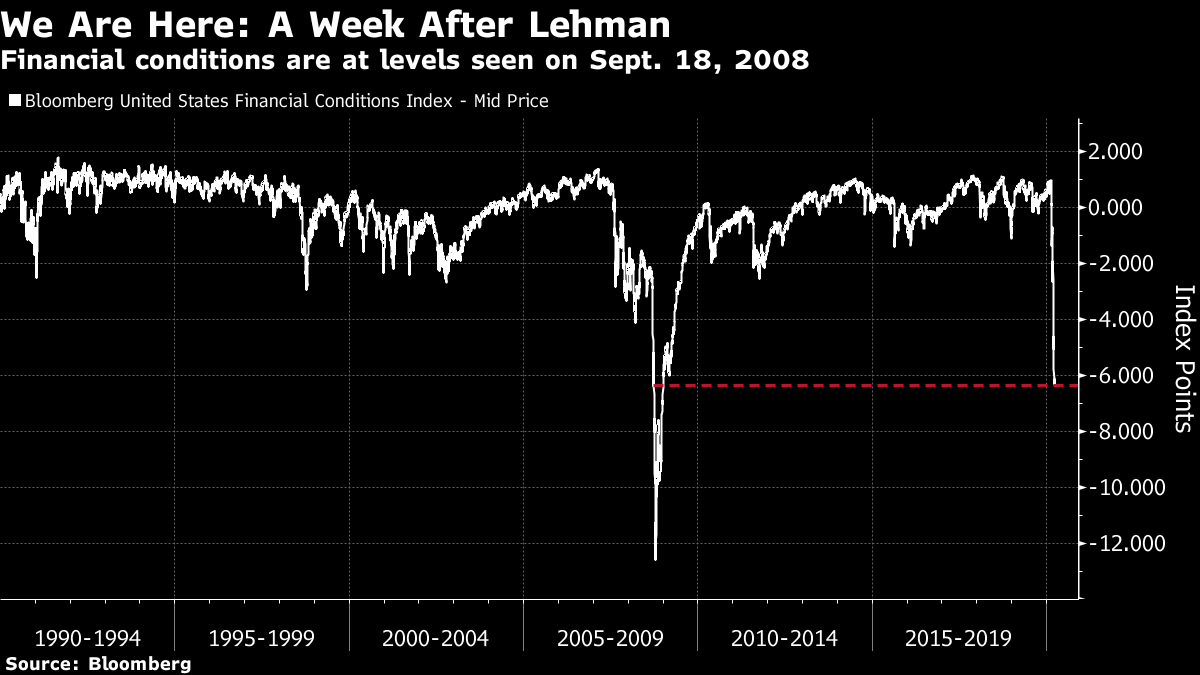 The index's low for this year matches the point it reached at the end of the week following the Lehman bankruptcy. On that occasion, the imbroglio over TARP, the collapse of savings bank Washington Mutual, and further rescue packages for Citigroup Inc. and Bank of America Corp., among many other things, ensured that financial conditions would tighten much further before they started to improve. If we look at the index in the five weeks since the equity market peaked, we can see that the decline has halted. It is way too early to say that a crisis has been averted, and that conditions will grow no tighter, but there are at least some signs that the desperate acts of central banks are having an effect: 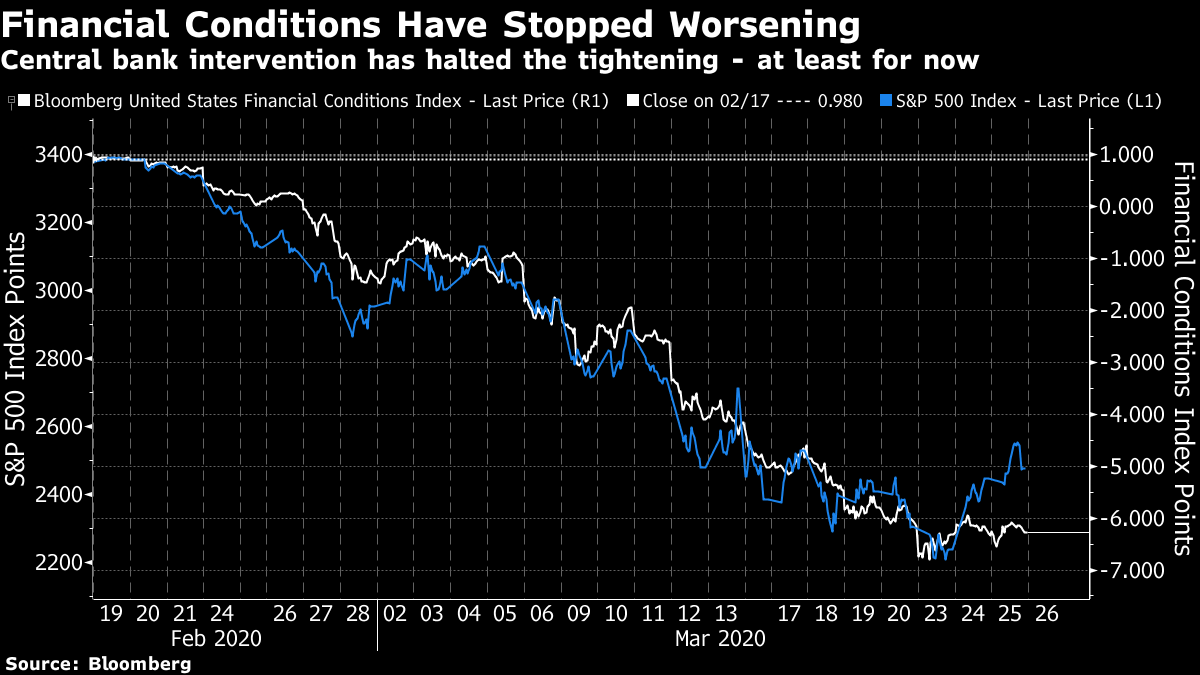 Perhaps most importantly, a rush for dollar funding appears to be abating. This was arguably the single greatest sign of stress in the global financial system, and saw the dollar log dramatic gains against developed and emerging currencies. Again, it would be foolhardy to say the problem is over, but it has eased a little in the last few days, and hence the broader panic also diminished. 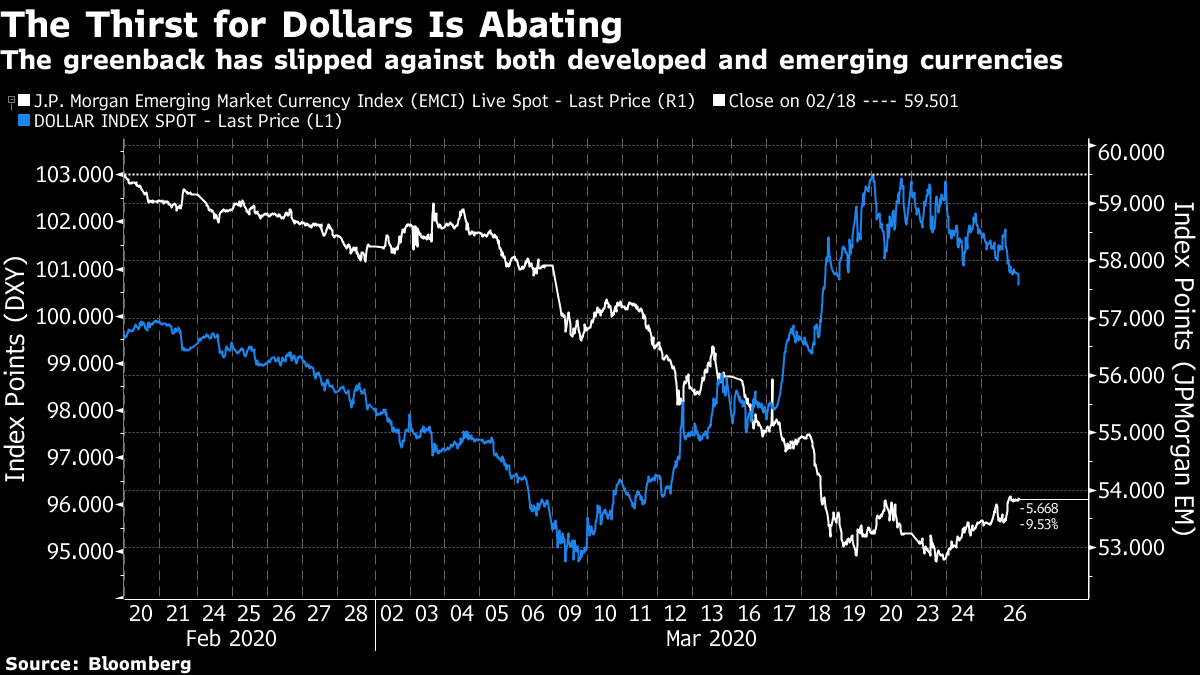 For another sign that this rally shows some relief that the financial crisis is abating, look at Bloomberg's measure of returns to leverage as a factor (full details of how this is calculated can be found at FTW on the terminal). The following chart shows the returns compared to the market that can be attributed to having high leverage. The sell-off of the last month was unambiguously driven by the companies with the weakest balance sheets. While this isn't clear from the chart, such companies have snapped back in the last two days: 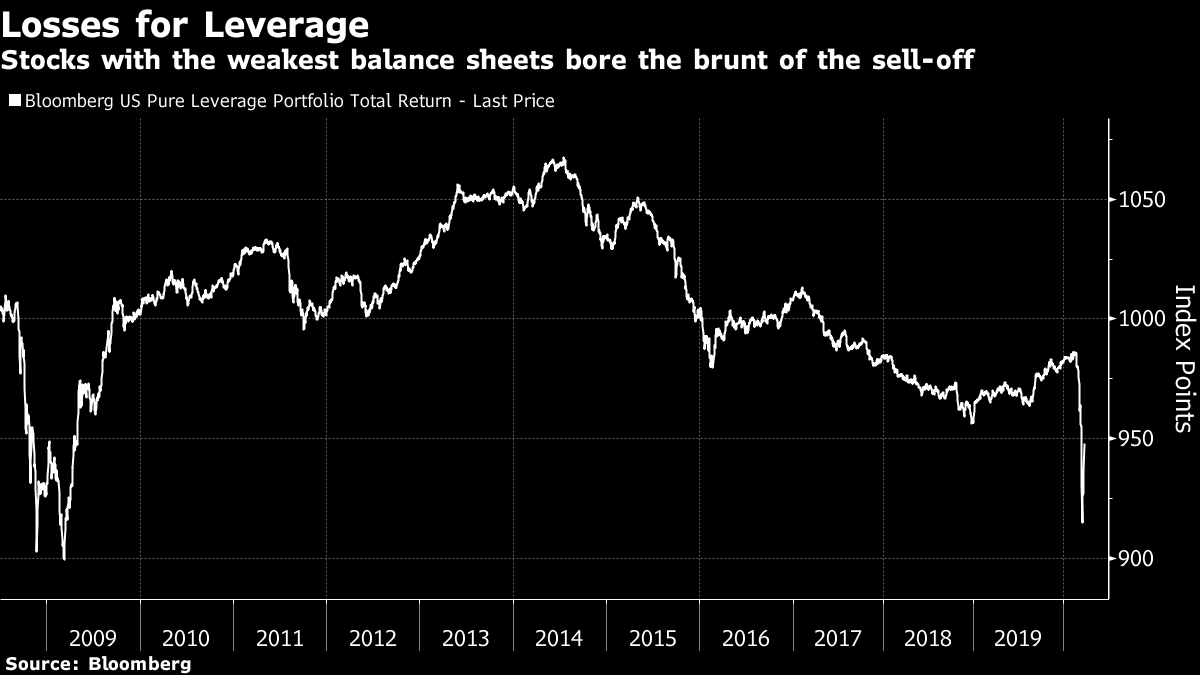 Beyond this, however, this is a strange rebound that leaves most of the equity market's underlying trends intact. Small companies rebounded compared to mega-caps, but not by much; the same is true of value stocks compared to growth. And while the dominant "FAANG" internet companies lagged behind the market slightly Wednesday, the group's trend of drastic outperformance remains perfectly intact: 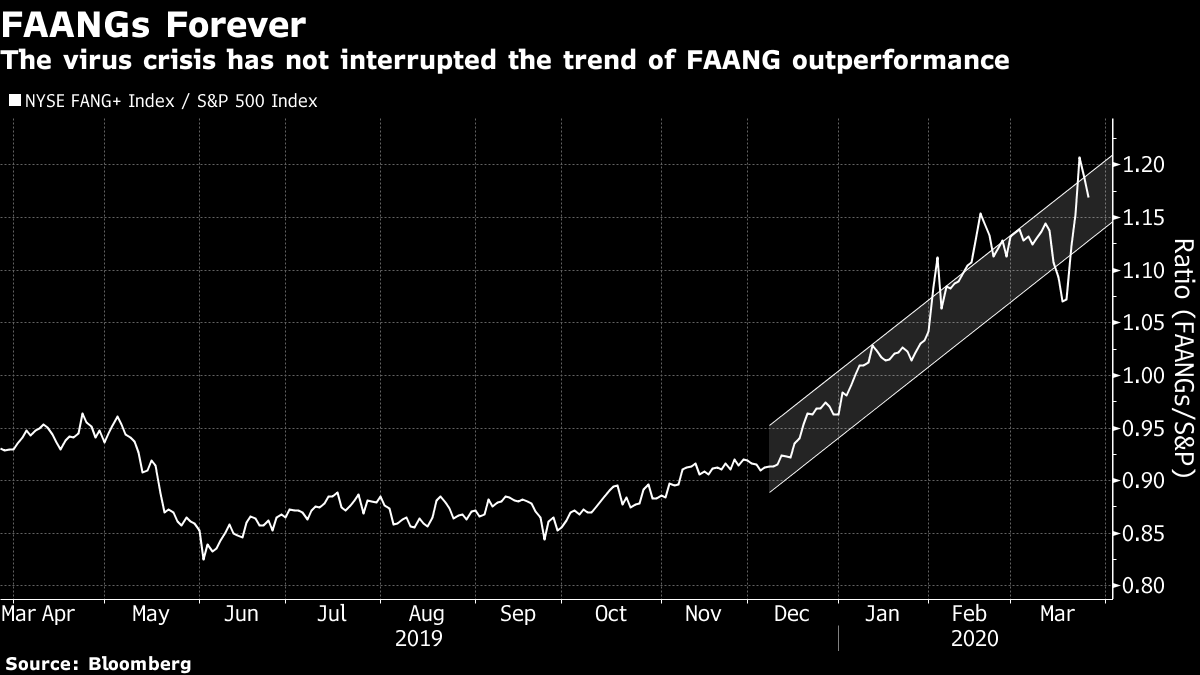 Rather than a serious reassessment of risks and opportunities within the market, then, the last two days have been a fairly indiscriminate "dash for trash." As Bespoke Investment shows, the worse a stock had previously sold off, the more it bounced. 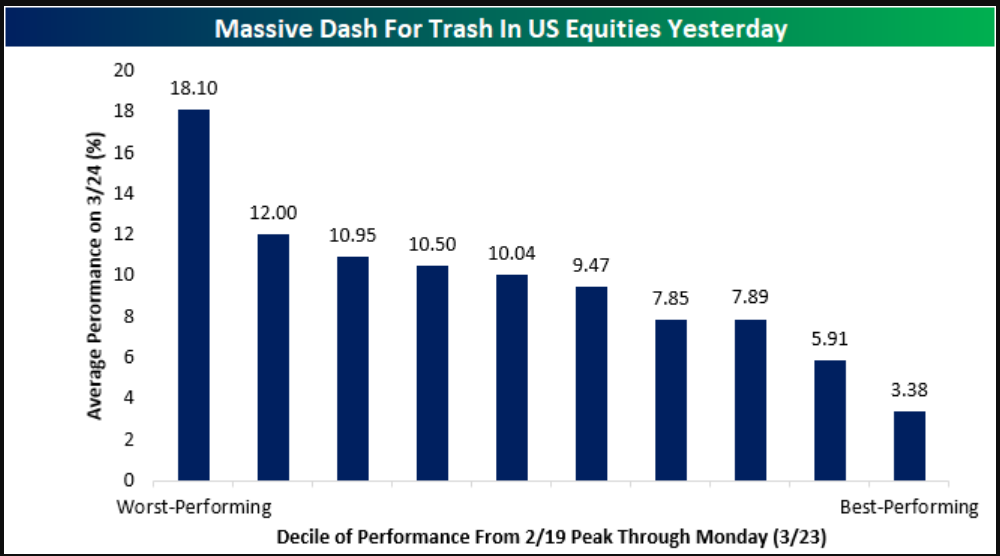 So this reflex leaves question marks — but it is fair to say both that it is primarily the latest demonstration of the market's physics after big sell-offs, and that it shows cautious optimism a credit crisis can be averted. Radical Uncertainty Data covering the first weeks of the U.S. response to Covid-19 are beginning to flow. There's no doubt the numbers will be bad; exactly how bad is a matter of sweeping uncertainty. Thursday morning will bring weekly figures on initial claims for jobless insurance, a key high-frequency measure of the jobs market. I had to put the following chart on a log scale. It shows the four-week moving average of claims over the last 20 years, along with expected number of claims each month, as reported to Bloomberg News by analysts. It speaks for itself: 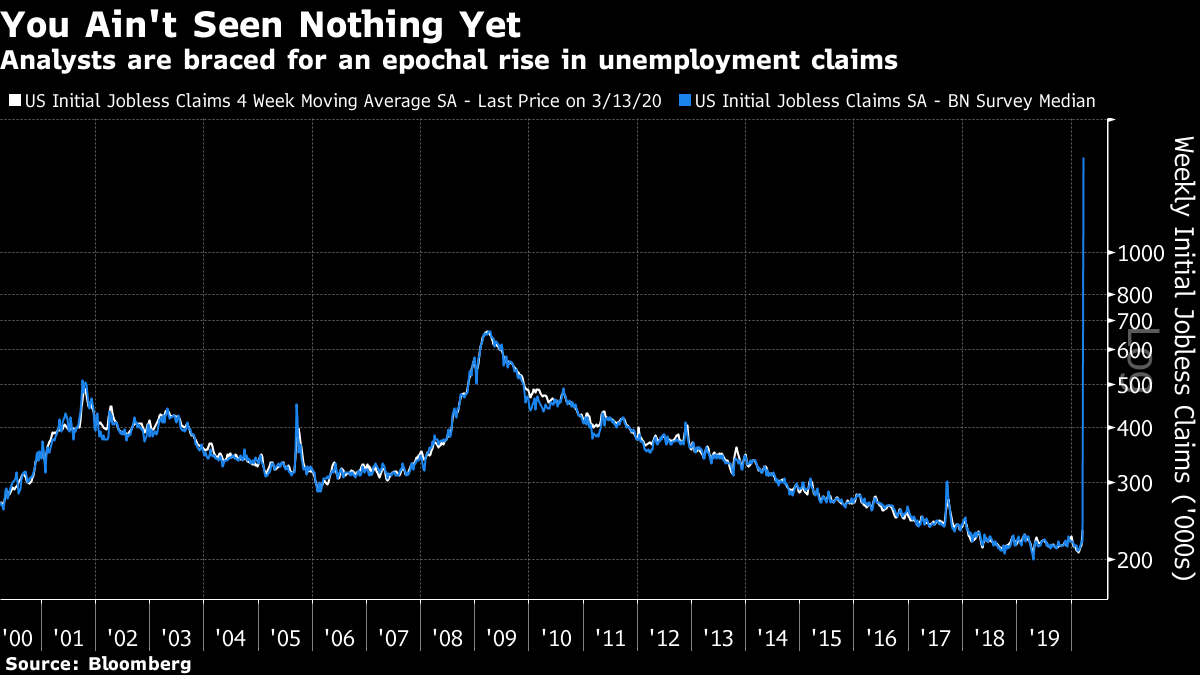 The figure is just the median. Many analysts think far more people could be signing on, with a top estimate of 4 million — in one week. If we look at the range between the highest and lowest estimates, which I again needed to put on a log scale, we can see uncertainty is almost off the charts. The previous greatest spread came in the first full week after Hurricane Katrina hit New Orleans in 2005. This act of God is even harder to predict: 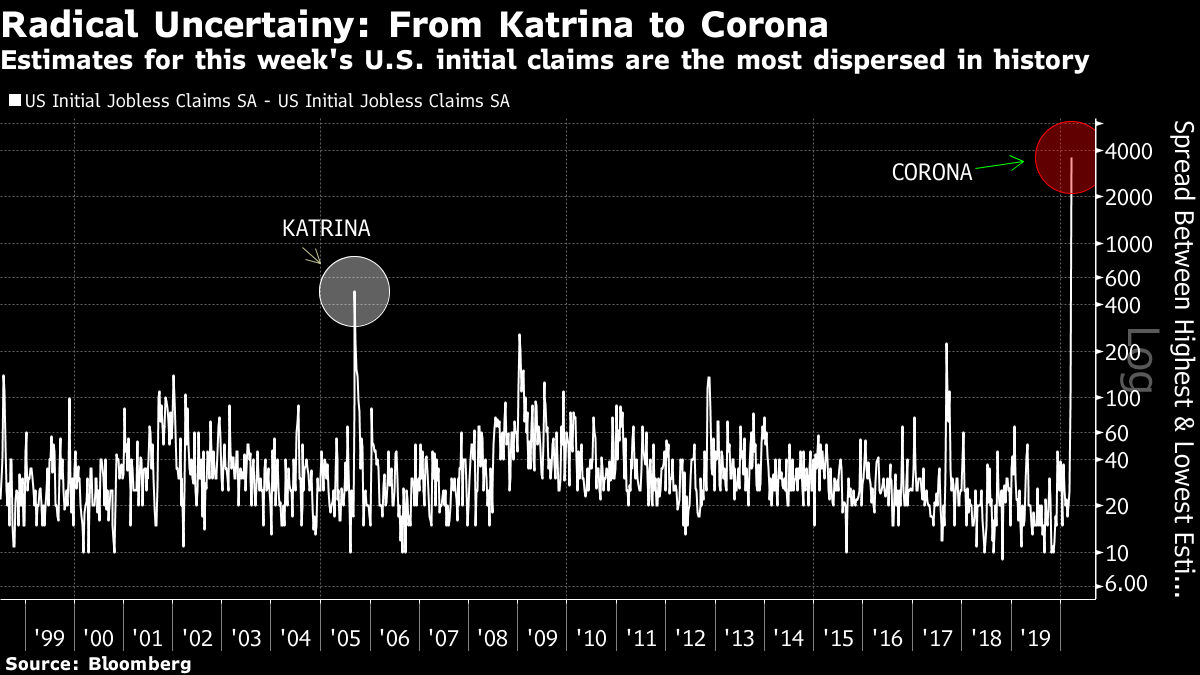 There's much talk about this number, but ultimately it's guesswork as to exactly how bad it will be, and how the market will react. Other high-frequency numbers make the slowdown in economic activity painfully obvious. This chart, from Torsten Slok, chief U.S. economist for Deutsche Bank AG, shows the proportion of hourly workers reporting to work, compared to the same days in January. It is based on a survey of 60,000 businesses with about a million hourly employees: 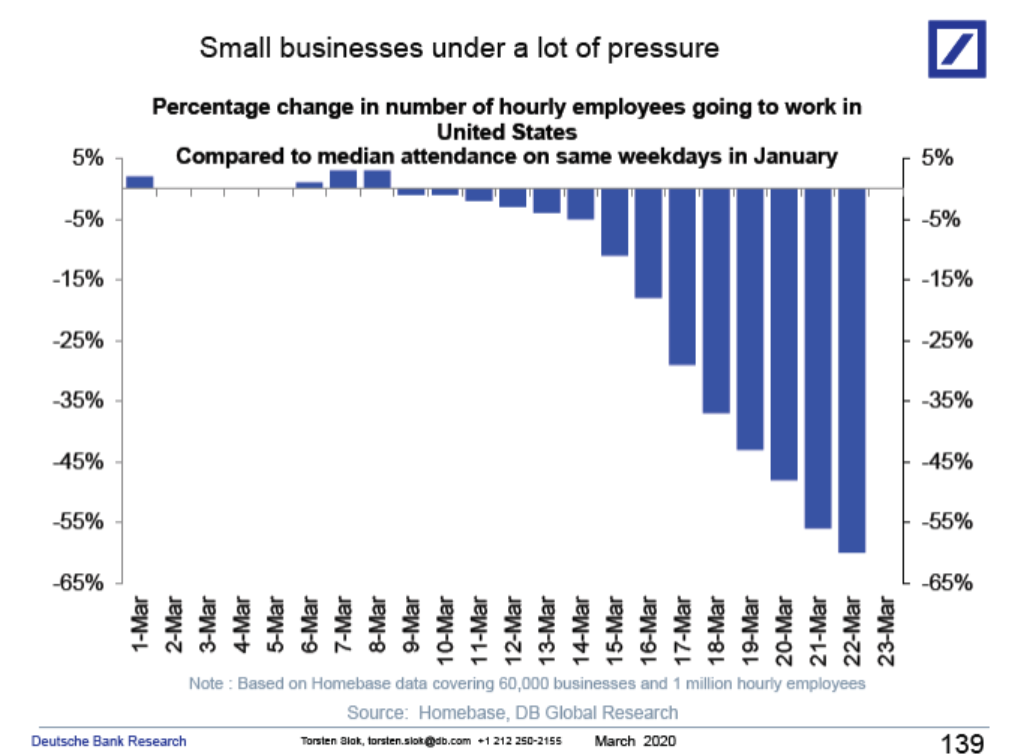 And airline passenger traffic data supplied to the Transport Security Administration show a 90% drop in trips compared to 2019: 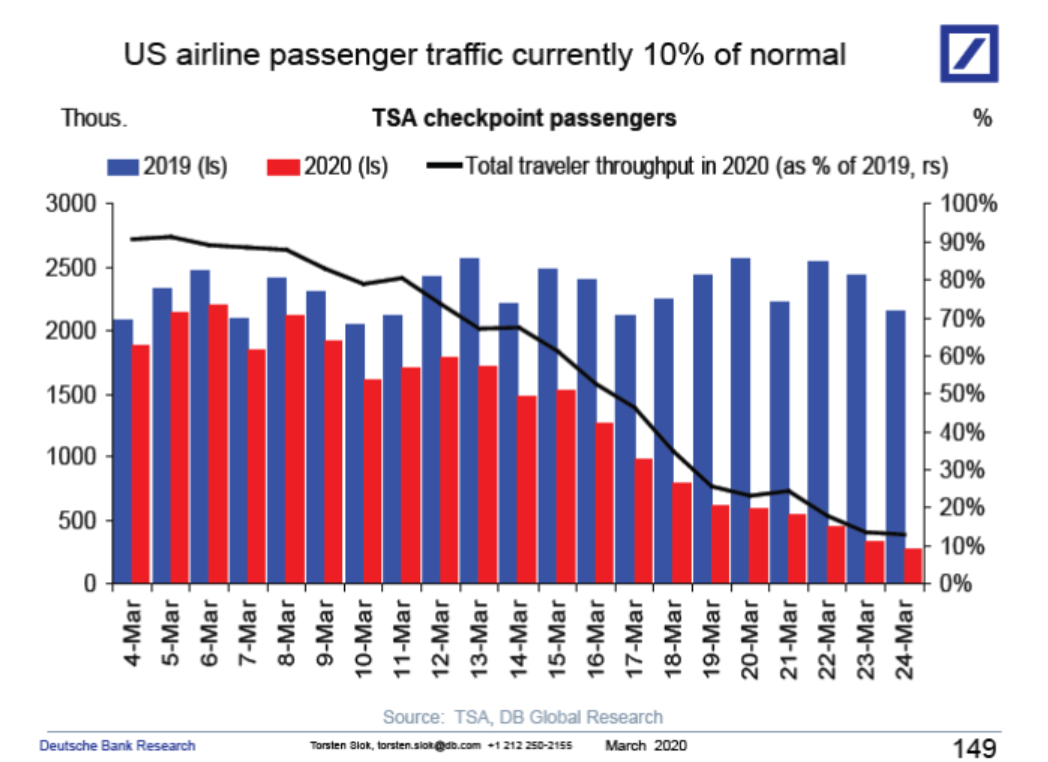 Understandably, there's similar uncertainty over earnings. Many analysts have been reluctant to update their forecasts. This means that the consensus of currently published estimates suggest only a slight fall in the second quarter. This chart from Jonathan Golub, U.S. equity strategist at Credit Suisse Group AG, compares the official consensus numbers with figures derived only from "fresh" estimates published during the last week. Again, the pattern is of radical uncertainty: 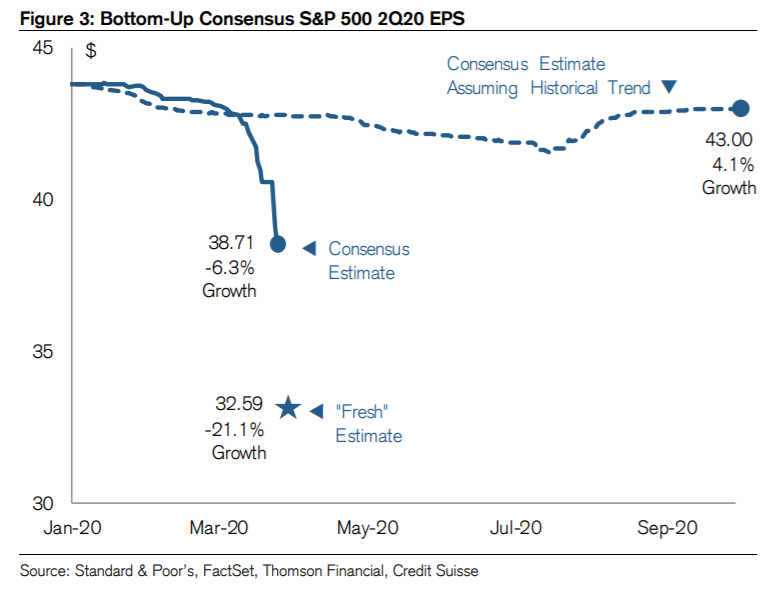 This is uncharted territory, and it will be difficult for markets or investment to function until the uncertainty is resolved. Grandparents vs. the Economy Finally, I wish to return to yesterday's note, in which I argued that it would be a mistake to try to return to normal unless there was strong confidence that the virus had been contained. I also argued that this was even what markets wanted. No lasting recovery will be possible for asset prices if fear of the virus remains. I stand by all of this, and am pleasantly surprised not to have received much negative feedback. But I do want to correct a fallacy that many have fallen into when defending my position. To want to return to work when reasonably possible and to try to minimize the economic damage isn't necessarily to put dollars and cents above your grandparents' lives. The trade-offs are more complicated. I direct people to this thread on Twitter, in which people responded to comments by Fox News commentator Brit Hume that the "utter collapse" of the economy would be intolerable, and it was a "reasonable viewpoint" for older people to be prepared to risk their lives to avert this. He in turn was responding to the statement by Texas Lieutenant Governor Dan Patrick that those over 70 shouldn't "sacrifice the country." Put this way, I find the trade-off offensive. In itself, the idea of sacrificing someone for the sake of money is reprehensible. The key point missing from this argument is that recessions tend to lead to more deaths and shorter lives. Such effects can be measured. For those interested, I recommend this paper by Philip Thomas, head of the risk management department at the University of Bristol. Using the "J-value" mathematical technique developed for measuring the cost-effectiveness of safety measures in the nuclear power industry, he models the number of lives that can be expected to be saved by different forms of economic shutdown. It finds that by far the most effective option would be an early 12-month lockdown with widespread vaccination at the end using a newly developed vaccine. This would limit deaths to a number below what might have been expected from flu in a typical year — but at a massive economic cost. This is when Thomas introduces the "J-value GDP constraint." He shows that the Great Recession of 2008-09, which saw real GDP per head fall by 6%, led life expectancy for 42-year-olds to be at least three months shorter than it otherwise would have been. In a country of more than 60 million, this is a huge loss of life. Using his mathematical assumptions, the lives saved by a year-long lockdown would be more than counterbalanced by a later fall in life expectancy, if the total hit to GDP were 6.4% or more. His conclusion is that the challenge for the U.K. and other governments is to manage interventions so that the recession isn't significantly worse than in 2008-2009. I am not a good enough mathematician to question the assumptions in the paper, which is awaiting peer review. I urge any good mathematicians reading this to take a look. Nobody should be asked or expected to sacrifice themselves. We don't have that right. But it is unfair to characterize this as choosing money over old people's lives. Recessions end people's lives too. Like Bloomberg's Points of Return? Subscribe for unlimited access to trusted, data-based journalism in 120 countries around the world and gain expert analysis from exclusive daily newsletters, The Bloomberg Open and The Bloomberg Close. | 


Post a Comment