It Could Have Been Worse Chinese markets have reopened after the lunar new year, and the results have been as horrific as expected. The CSI-300 index, which covers the main A shares quoted on the Shanghai and Shenzhen exchanges, fell more than 9% at the open, the worst decline since Feb. 27, 2007. That day, those with long memories will recall, went down in history as the "Shanghai surprise" that fatally punctured years of low volatility in the U.S. and Europe and set the stage for the global financial crisis. In the shocked selling that followed, indexes in New York had difficulty keeping up, leading the Dow Jones Industrial Average to gap down by several hundred points in a matter of seconds. For various reasons, I doubt that this mainland Chinese trading session will cause anything like such contagion in the rest of the world. The main reason to say this is that the A-share market has really only caught up with what was happening in H shares, quoted in Hong Kong, while China was closed. This chart compares the CSI-300 with the Hang Seng China Enterprises Index: 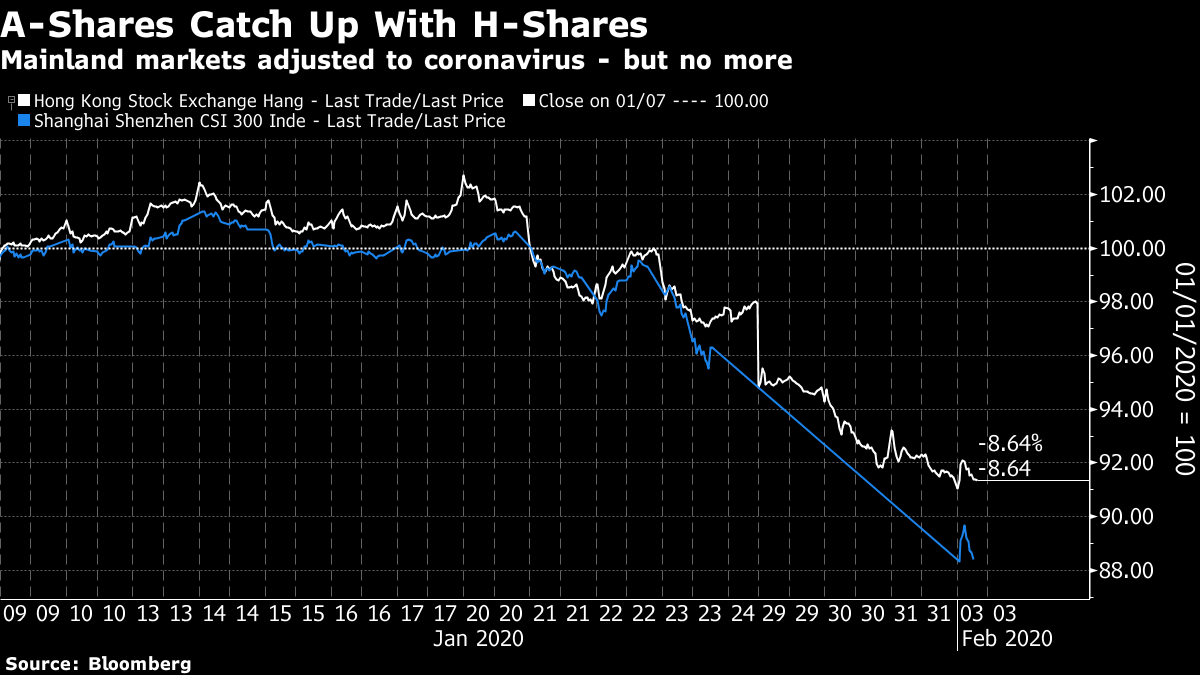 At the time of writing, as many Asian exchanges approached their midday trading break, the damage was surprisingly limited. Hong Kong indexes were up very slightly, and the same was true of the Kospi in South Korea. Nowhere else in the Asia-Pacific was trading as though there was significant new bad news on the coronavirus. In China itself, a long-lasting positive trend has indeed been snapped. The CSI-300 had been trading above its 200-day moving average for almost a year. That is over: 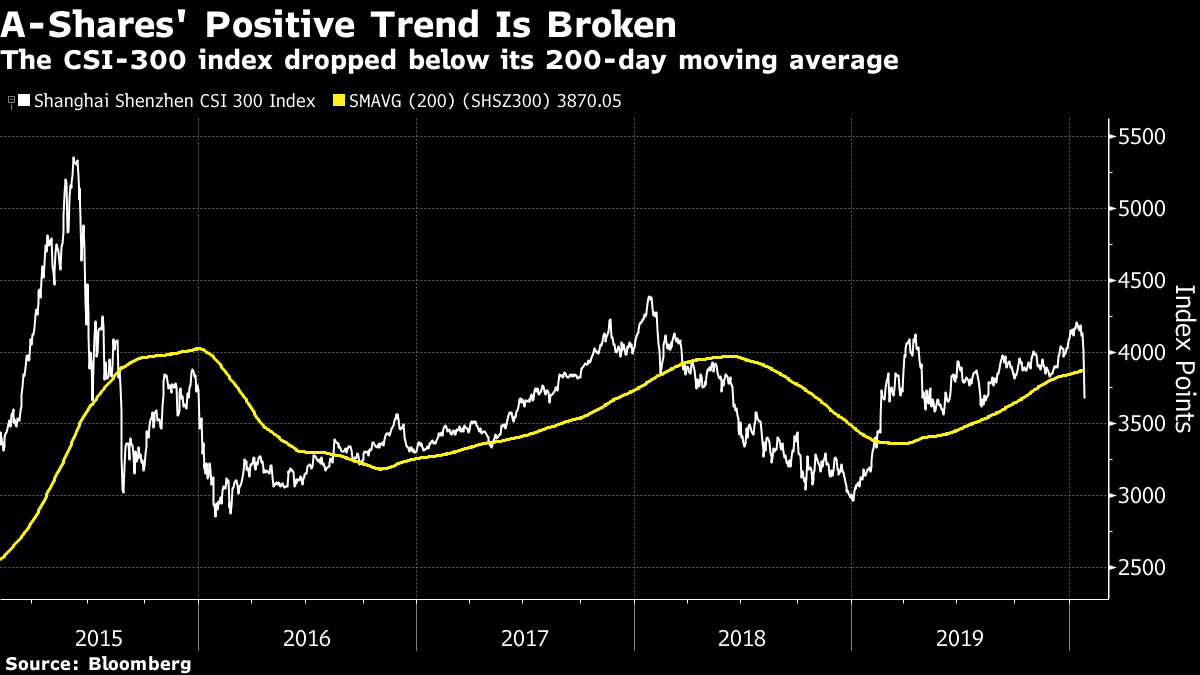 As for industrial metals, for which China has long been the global price-setter, iron ore suffered a big sell-off on the Dalian commodity exchange — but again, one that was in line with action in metals markets elsewhere while China was celebrating the holiday: 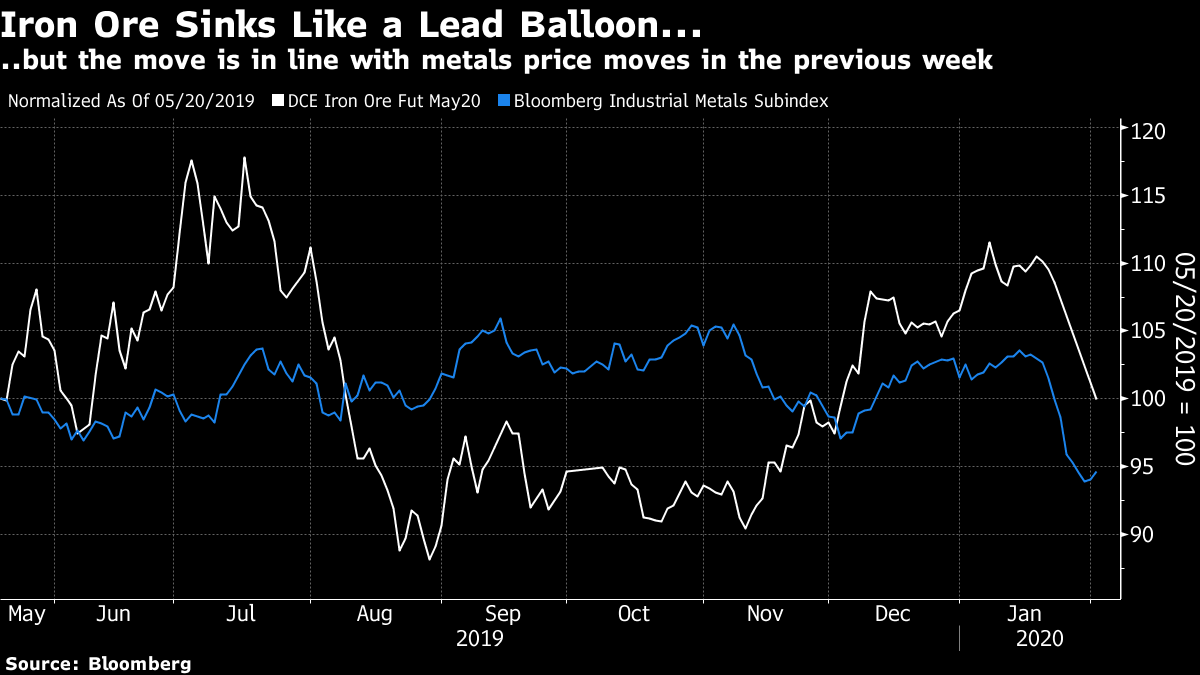 In currency markets, the yuan has again passed the level of 7 to the dollar, but in this it was again merely playing catch-up with offshore market activity. And the main economic data for the day, the Caixin industrial PMI, was slightly better than had been expected — although the survey was taken before the extent of the coronavirus problem had become clear. In sum, the reopening of Chinese markets was ugly, but provided no new reason for people outside China to sell risk assets that they hadn't already sold by the end of last week. For now, the two critical issues are whether the coronavirus continues to spread at a geometric rate for more than a matter of days, and the toll on the Chinese economy and manufacturing sector. For the progression of the virus, this chart from Kambiz Kazemi of La Financiere Constance in Toronto offers a useful rule of thumb: 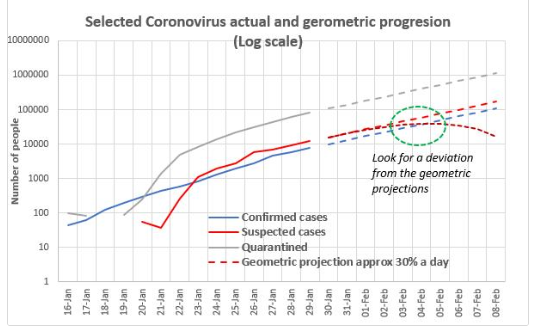 What matters is the speed of the spread, and we need to look at this on a log scale. Using the most recent data, there appear to be about 30% more cases each day than the day before. Assuming this continues, his projections are that there would be over 80,000 cases by the end of this week, and more than 130,000 suspected cases. If the outcome is below these numbers, that would be good news, even though it would mean that more people would be sick. As for the extent of the damage to the economy, James McCormick of NatWest Markets Plc extrapolated the impact of SARS on to the global manufacturing sector (taking into account that China is now far bigger), and came up with a prediction that this would cause the global manufacturing PMI to drop to 46.45 (while China's manufacturing number dropped to 40). That would be the worst figure since 2009, but still far above the levels touched during the last two recessions: 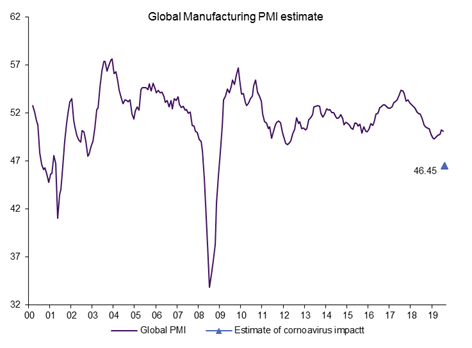 Manufacturing numbers due to be published later Monday will cast only a little light on this. The full extent of the damage won't be clear until the end of February. We should have clues much sooner than that on whether the virus is being contained. In Case You Missed It Markets have always been, and always will be, prone to deep pessimism and to mania. But January was different. Appropriately for a month named after a God who faced in two directions at once, dread and mania are both present in the most important and liquid financial markets. The coronavirus is helping this state of affairs but cannot explain all of it. With apologies for repeating myself, let me take you through the charts that show quite clearly that markets are positioned for doom and disaster. I shared some of these at different points last week, and by the end of trading Friday they had moved to take even more extreme positions. In all cases, these end before the opening of Chinese markets Monday. Dread Let us start with an old favorite, the Treasury yield curve, which tends to be a good recession predictor. The most successful is the spread between three-month and 10-year yields, which hasn't sent a false signal for more than 50 years. It inverted, to much terror, last year. It recovered as the trade conflict eased. And it sharply flattened again throughout January, closing the month in an inversion once more. There are arguments that this indicator may not be as good as in the past, largely drawing on the impact of exceptional monetary policy. But on the face of it, it would be wise to treat this persistent inversion as a warning signal: 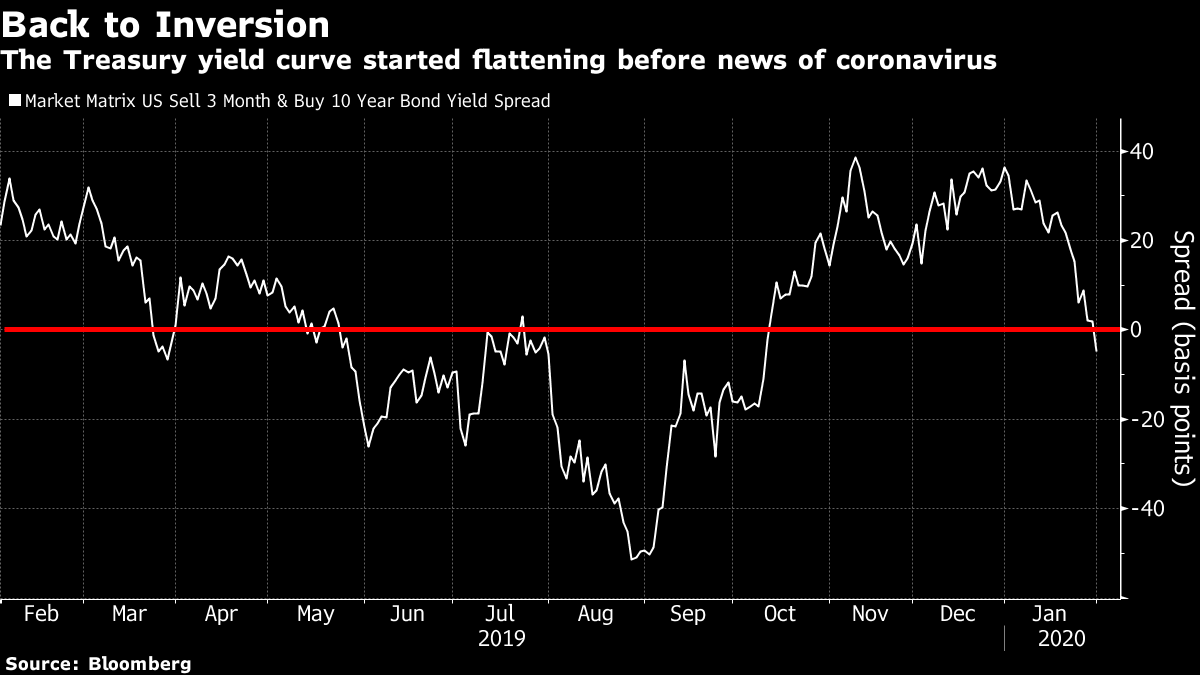 Now, let us turn to long-term real rates, the difference between 10-year yields and the forecast for 10-year inflation produced by inflation-protected Treasuries (TIPS). Real yields are almost always positive. To be negative requires profound pessimism. They turned negative when the Fed resorted to "QE infinity," and stayed that way until May 2013, when the "taper tantrum" answered the Fed's attempts to prepare the market for the end of QE. Real yields closed Friday at a fresh post-tantrum low. They are negative, and lower than their level for the panic that followed the Brexit referendum in the summer of 2016: 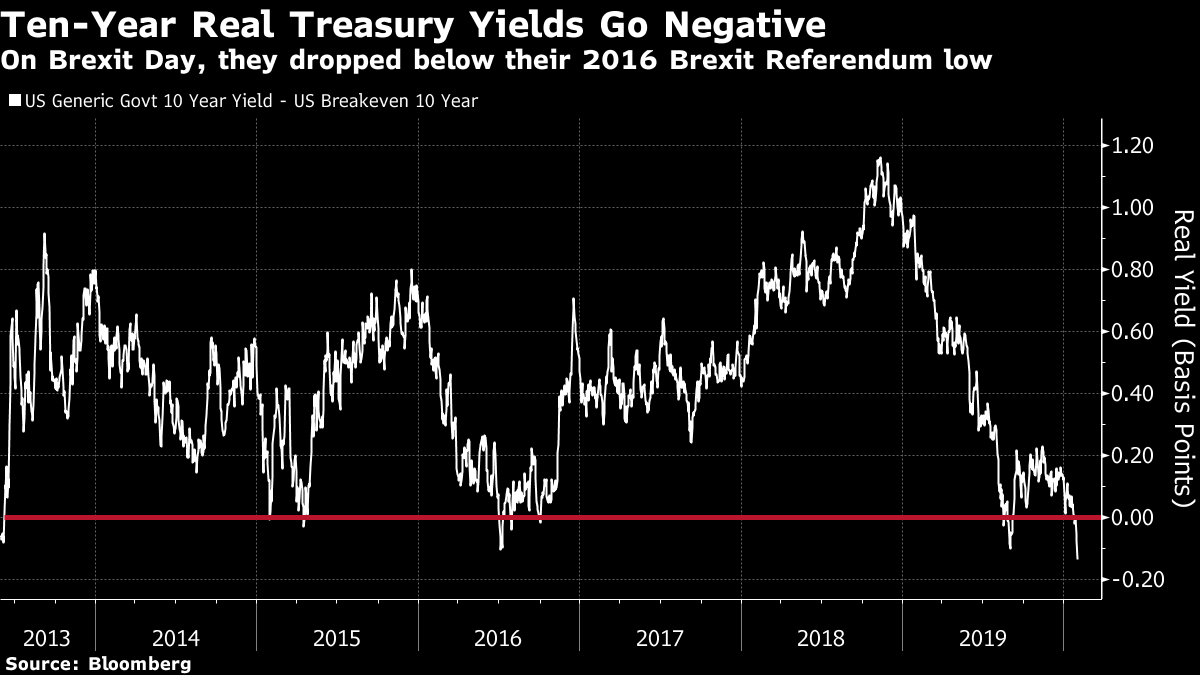 Then, consider gold. Its price is at a seven-year high, and has rallied by 51% since its nadir for this cycle in late 2015. All of these phenomena are related, and imply a low-growth world in which interest rates must stay depressed. With gold, as with the bond market indicators, there was a sharp move toward optimism and a belief in growth in the spring of 2013, which has now been canceled out — and that move started long before the coronavirus: 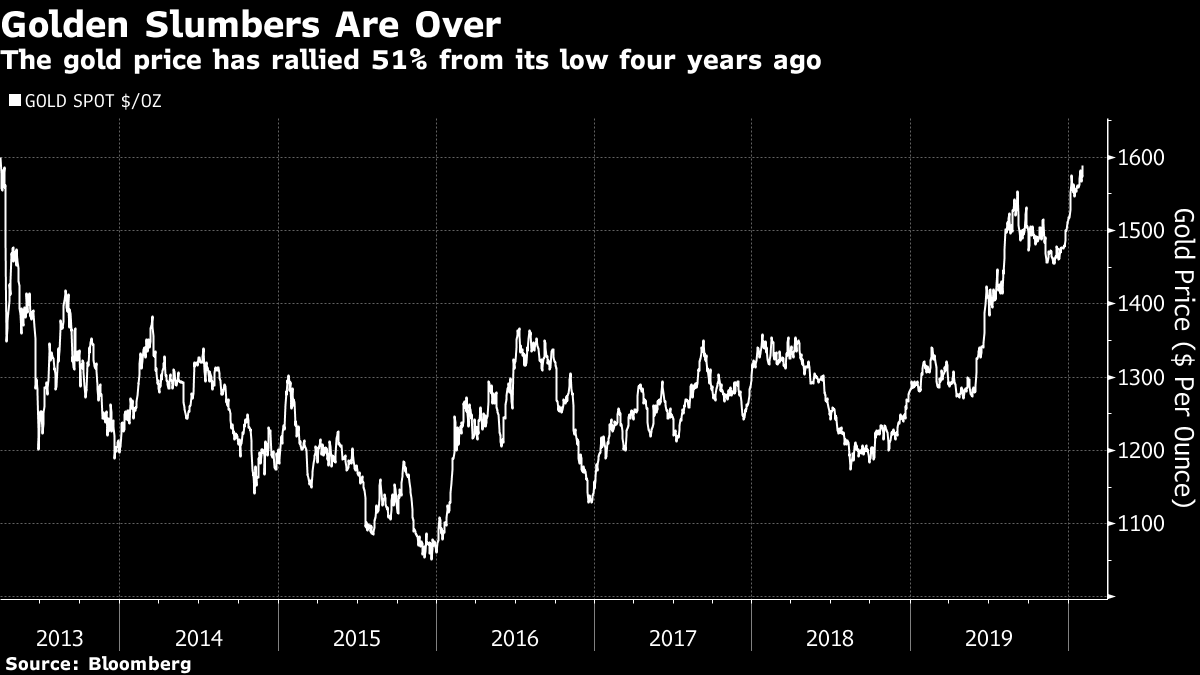 Gold's price is more relevant when compared to other metals, and this tells a worrying story. Traditionally, the ratio of copper prices to gold is held to be a good measure of the industrial and business cycle. When copper is strong compared to gold, people are optimistic about the economy; when copper is cheap, it implies concerns for the future. The copper/gold ratio is now close to its lowest in several decades: 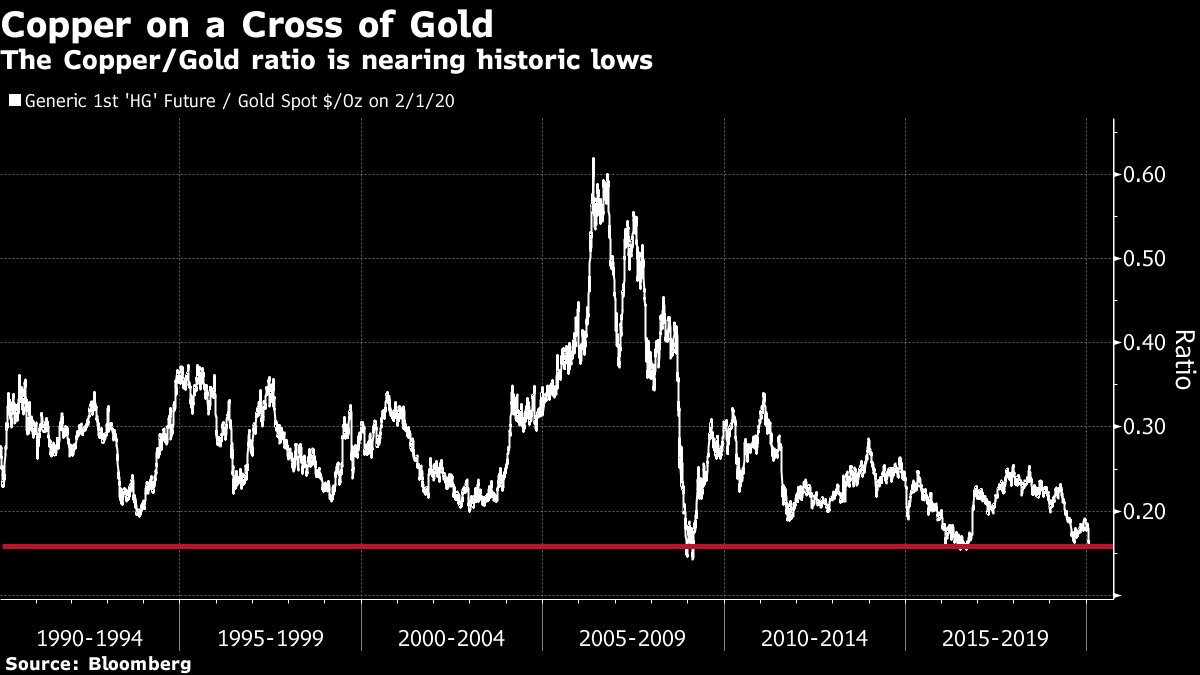 Stocks are evidently not showing anything like the same scale of alarm, in aggregate. But if we look at its internal dynamics, we can see that the market has now shaken off all the optimism that surrounded the election of Donald Trump in November 2016. As the chart shows, industrials have underperformed utilities since then, a classic symptom of a declining economy; while small-cap stocks (in the Russell 2000) have far underperformed the mega-caps of the Russell Top 50. Both are patterns you would normally only expect to see in a declining market bracing for a recession: 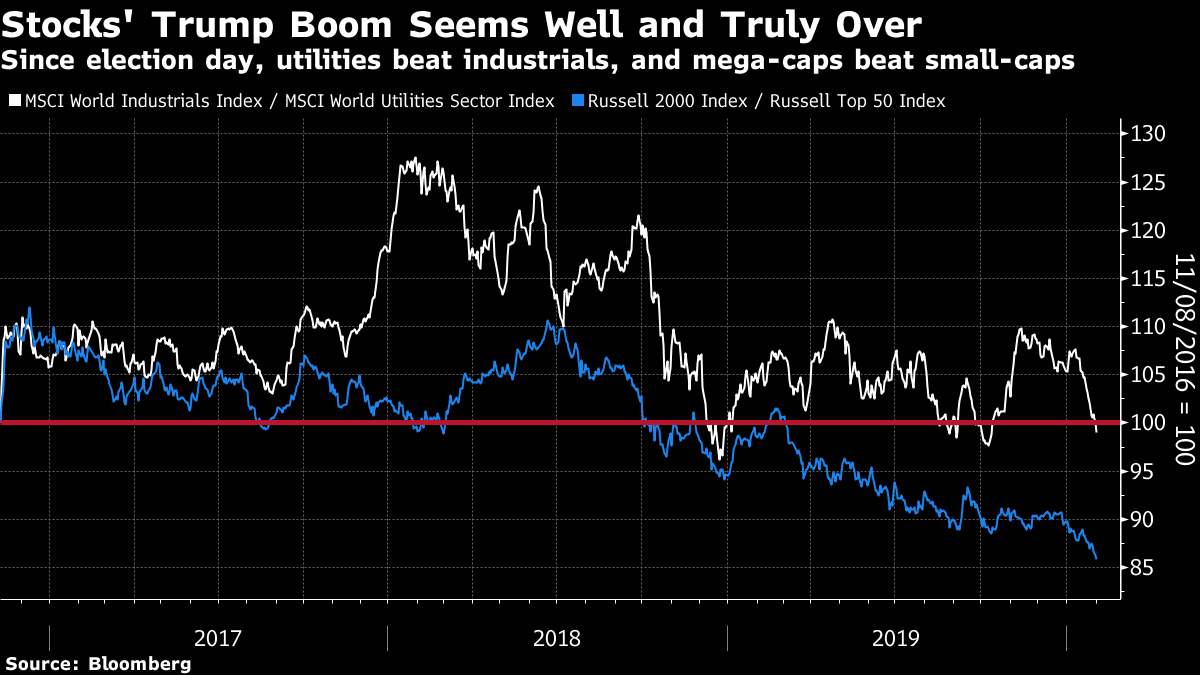
Mania Now for the signs of mania. In the U.S., the S&P 500 finished January less than 0.2% below where it had started. This was despite the assassination of Iranian general Qassem Soleimani at the beginning of the month, which briefly caused World War III to trend on social media, and of course the terrifying advent of the novel coronavirus. The stock market's resilience is all the more impressive because it is phenomenally expensive. There are plenty of deep debates to be had about some of the longer-term and more complicated valuation yardsticks that have shown American stocks to be overextended. So here is a very simple yardstick — the price of stocks compared to the revenues they have made in the last 12 months. On this basic and sensible measure, the S&P 500 is now more expensive than it was at the top of the dot-com boom in early 2000. Its journey to this valuation has taken the same time as the bull market of the 1990s: 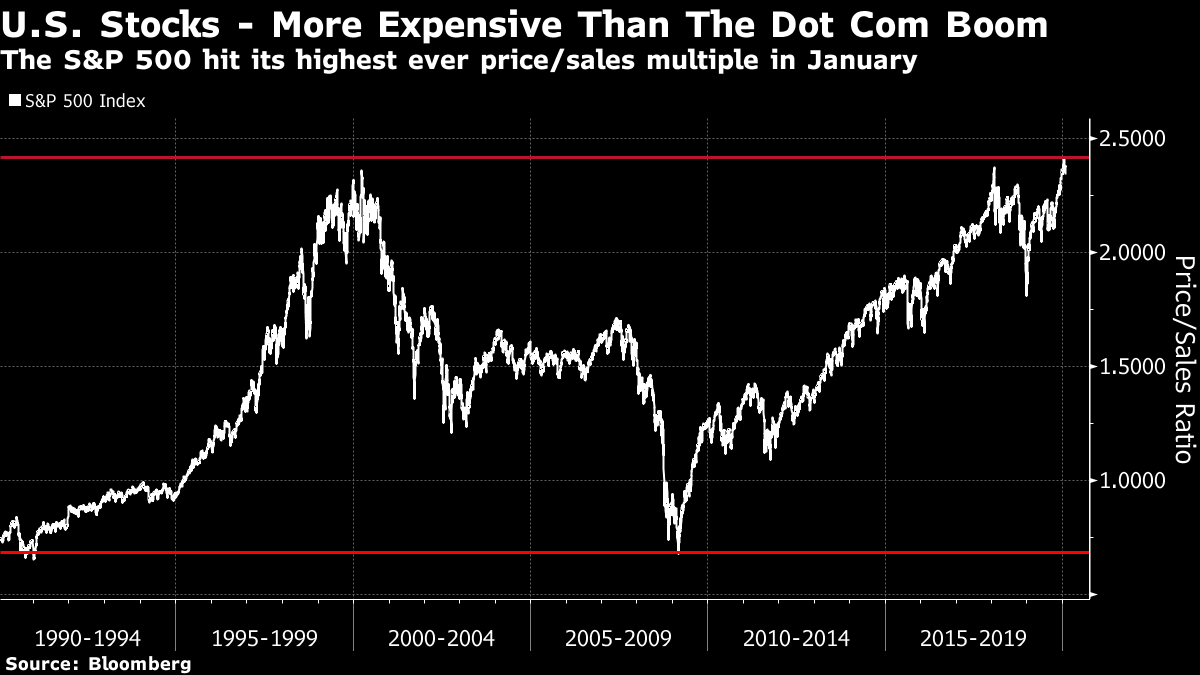 Then there are alarming signs of concentration in a few hot stocks. This hasn't been seen on such a scale since the top of the dot-com bubble — although to be clear, this time around the top stocks don't seem quite so overheated. The following charts from Anastasios Avgeriou of BCA Research Inc. show, first of all, that today's share of total market cap for the biggest five companies is strikingly similar to the share of the biggest five 20 years ago: 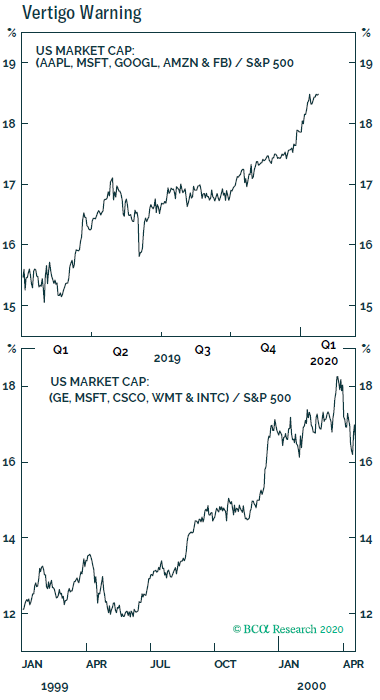 This time we haven't seen a widespread return to the 1999 practice of companies getting lofty valuations before they have made profits. But if we look at the biggest stocks that have risen the most, we arrive at a new acronym — the ATLAS stocks (for Apple Inc., Tesla inc., Lam Research Corp., Advanced Micro Devices Inc. and Salesforce.com Inc.). Avgeriou had a filter that looked for large-cap stocks that were at all-time highs and had increased in value by at least 10 times since 2010. Here is how the ATLAS stocks have performed over the last decade compared to an index that combines the price performance of a number of different bubbles in the decade before their peak. As we can see, the ATLAS stocks look identical to the bubbles in the Nasdaq Composite, the Nikkei 225 and various notorious commodity bubbles: 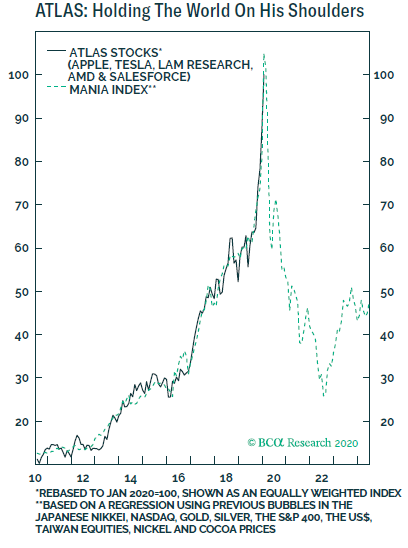 That completes the argument for Mania. Demand for a select group of stocks connected with a glossy view of the future has gone ballistic, even as the bond and commodity markets settle into the defensive crouch that suggests a recession is coming. A Reconciliation Can we reconcile the doom and the mania? Both are extremes that suggest markets have overshot. But such extremes cannot co-exist for much longer. And generally, it makes more sense to trust the bond market than the stock market. Absent clear evidence that the global economy is in better health than many now think, and (before much longer) equally clear evidence that the coronavirus epidemic is under control, we can expect the doom-mongers to bring down the maniacs. Iowa Caucuses With the Super Bowl over for another year, Americans move on to the four-yearly ritual of the Iowa caucuses. Nobody has cast any votes yet in the Democrats' process to choose a presidential nominee, but the swings in the perceived chances of the candidates have been wide. If we believe the prediction markets, nobody has ever had even as much as a 50% chance of victory, barring a few days when Senator Elizabeth Warren led the race. Six or even three months ago, I doubt that anybody would have expected the picture that the Predictit market now shows. With both Warren and Pete Buttigieg, the former mayor of South Bend, Indiana, perceived to be slumping, bettors now believe that the nomination is a three-horse race between three white men in their late 70s. Vermont Senator Bernie Sanders is rated a 42% chance, with former Vice President Joe Biden at 29% and former New York Mayor Michael Bloomberg (the co-founder and majority owner of Bloomberg LP, the parent company of Bloomberg News) at 19%. 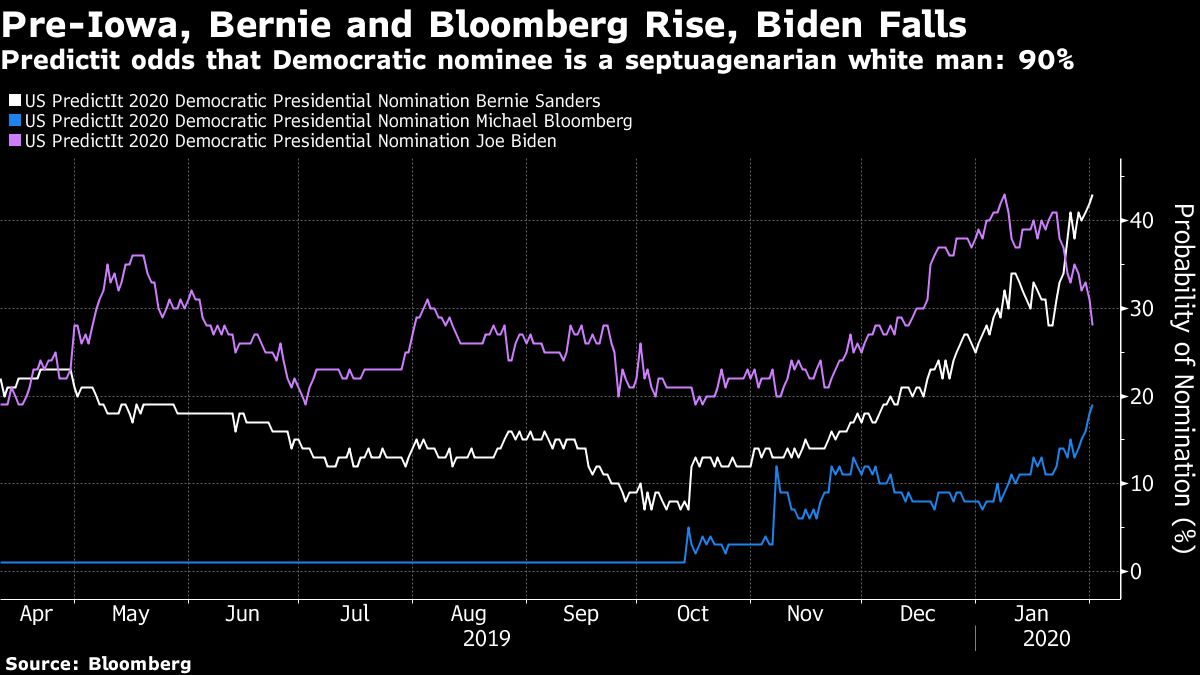 The political drama on the prairies appears to be having little impact on markets. This is on the assumption that Sanders (undeniably market-unfriendly) would have little or no chance of defeating President Donald Trump, while Biden or particularly Bloomberg would be seen as market-friendly. Let us see whether those assumptions survive their first confrontation with the American electorate, when Iowans gather to caucus Monday night. Like Bloomberg's Points of Return? Subscribe for unlimited access to trusted, data-based journalism in 120 countries around the world and gain expert analysis from exclusive daily newsletters, The Bloomberg Open and The Bloomberg Close. | 


Post a Comment