U.S. Profits: Some Definitional Issues Last year was a great year for the U.S. stock market. Most of us have gathered that. We also know that this had very little to do with profit growth and almost everything to do with growth in the multiples that investors were prepared to pay to gain a share of those profits. Such a situation cannot continue indefinitely. So what exactly is happening to profits, and what growth is it reasonable to expect? That question proves hard to answer. A first problem is that looking at the stock market as a whole can be misleading. Banks and financials generally need to be separated out, especially when looking at issues of leverage. And for the remainder of the stock market, the hugely variable price of oil means that much of the variability in overall profits comes from energy companies, which these days make up a small proportion of overall market value. The following chart was produced by Andrew Lapthorne, global head of quantitative research at Societe Generale, and shows the sectoral breakdown of sales growth over the last decade. Oil and gas companies, in green, dominate both rises and falls. 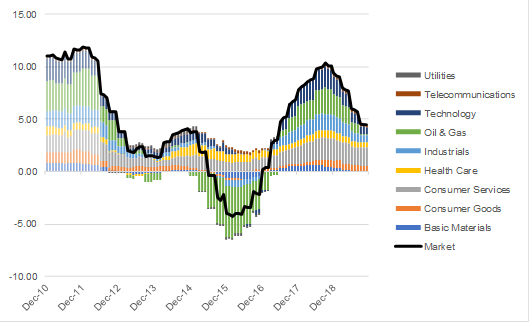 This is the same exercise repeated for profits. Note this time that the big swings of the last five years were driven almost entirely by energy companies, and that these effects have finally dropped out of the equation. What we are left with is very weak profits, showing a decline over the last year. 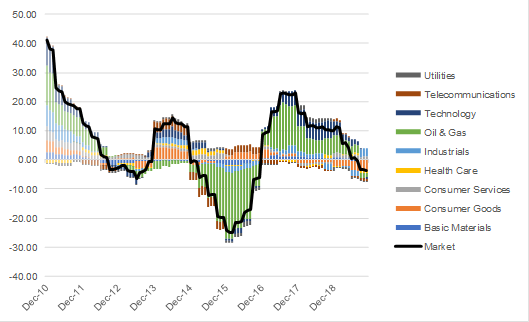 There is another issue, however, which comes in the difference between profits as measured by the government and by companies themselves under accrual accounting. The National Income and Product Accounts (NIPA) figures have been falling for several years and appear to show the kind of fall in profits as a share of GDP in the U.S. that usually only happens during recessions. The following chart is from Chris Watling of London-based Longview Economics: 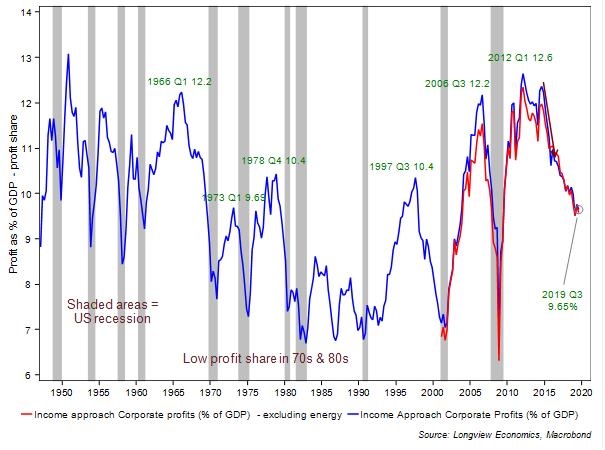 This seems straightforwardly terrifying, but again we need to be careful. What matters most is corporate cash flow. If we look at cash flows from the NIPA accounts, and subtract dividends, capital expenditures and share buybacks (the main choices for a company's use of the cash it generates in profits) we discover that companies have a cash deficit (they aren't bringing in enough cash to pay for all of these expenditures per year) but also that this deficit isn't as great as it has often been in the post-war era, and remains somewhat above the level that would normally presage a recession: 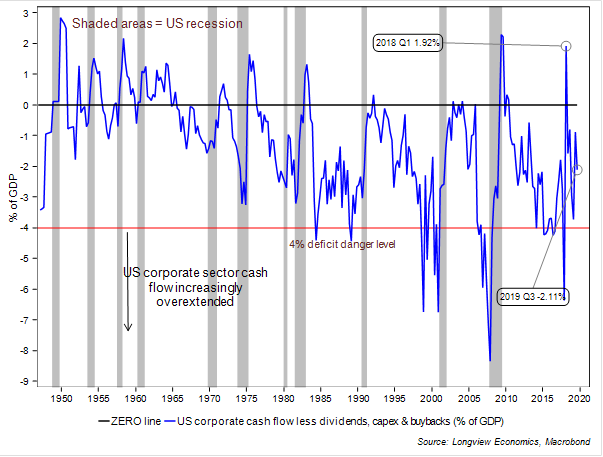 This implies that concern for the economy shouldn't be overdone. But growth in NIPA profits tends to overlap with growth in the stock market. The following chart, produced by Gaurav Saroliya of Oxford Economics, shows that it is difficult for the S&P 500 Index to rally for long if profits aren't rising. This is not surprising: 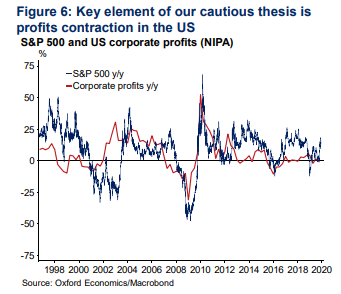 Then we need to add another critical element: debt. The following chart, also from Saroliya shows that corporate debt is rising steadily faster than profits — and that the debt spreads have remained low, implying that many balance sheets would be very vulnerable to any loss of faith in creditworthiness that sent spreads and interest rates higher. 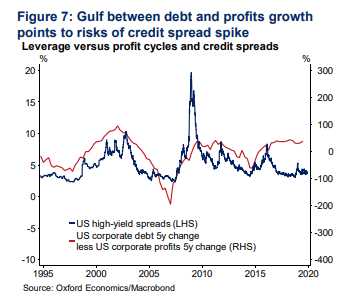 The combination of falling corporate profits and the need for companies to pay off a growing amount of debt sounds alarming. So we can expect minute attention to corporate balance sheets as the year progresses, while the pressure on the Federal Reserve not to raise rates will remain intense. But there is some good reason to hope that the profits picture isn't as bad as it appears. Watling of Longview Economics points out that the tax reform of late 2017 also gave companies an incentive to accelerate depreciation charges to take advantage of new capital allowances. As the NIPA accounts show, there was a big rise in depreciation, which was unrelated to any transactions in cash: 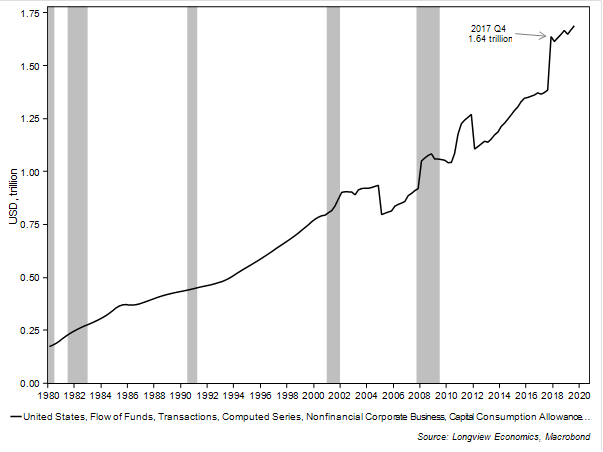 Removing depreciation from the picture still leaves us with a slowdown in U.S. profit growth, particularly given that the stock market is taking so much profit growth for granted. But at least it grows less alarming: 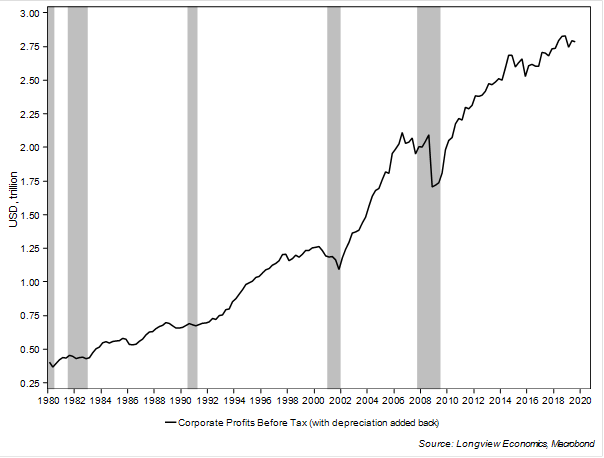 The big tax cut is now two years into the past. Over the next few months it should become easier to assess what real effects it has had on companies in the U.S. That in turn will provide a much clearer picture of the health of the U.S. corporate sector. Don't Forget Politics The U.S. presidential election campaign is still only in very blurry focus for markets. Many would say that a re-election for Donald Trump is likely if their outlook for the economy (which generally does not include a recession or a financial crash this year) proves accurate. But the presence of unusually progressive left-wing candidates may have affected the mood. In particular, Massachusetts Senator Elizabeth Warren has become a central part of the market conversation, as this chart can attest: 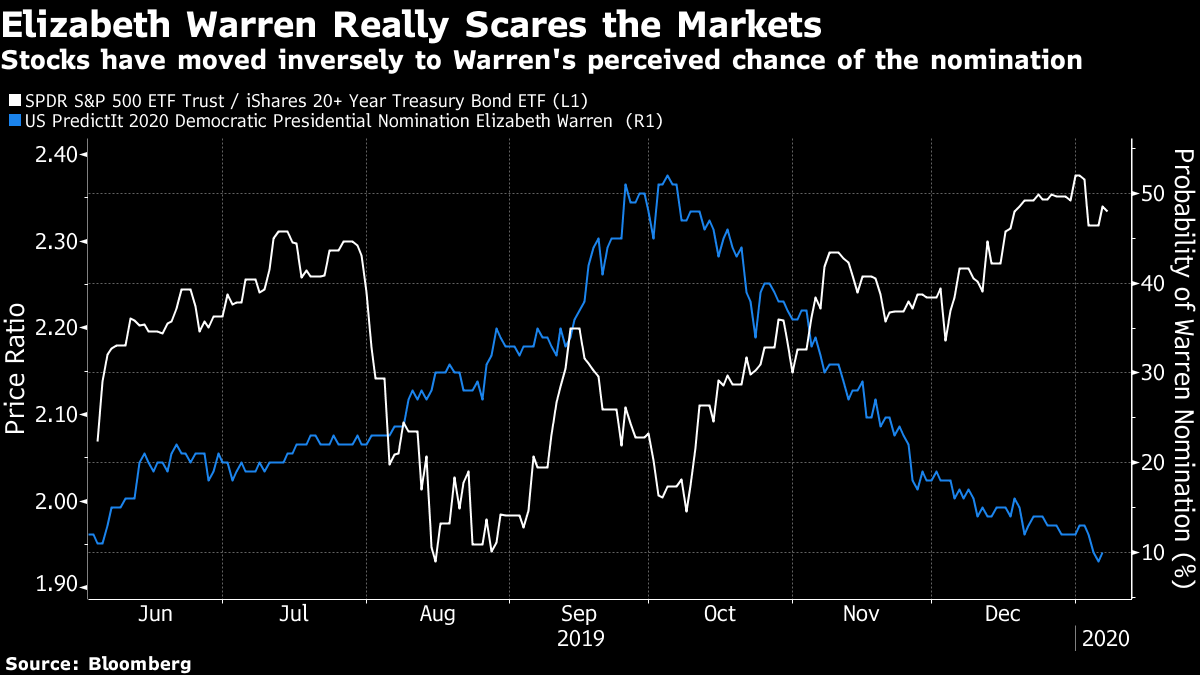 Many other factors were at work in the stock market's swoon last summer, and its rally into the close of the year, but if we compare the Predictit prediction market's odds on a Warren nomination (in blue), to stocks' performance relative to bonds, it does certainly look as though the end-year rally was buoyed by relief at Warren's dwindling prospects. According to Predictit, her chances of winning the nomination are back below 10%, having at one point in early October exceeded 50%. Keep in mind, though, it's still a long way until Election Day. Like Bloomberg's Points of Return? Subscribe for unlimited access to trusted, data-based journalism in 120 countries around the world and gain expert analysis from exclusive daily newsletters, The Bloomberg Open and The Bloomberg Close. | 

Post a Comment