An Even More Depressing Chart Last week, I published a chart described by its creator as the "most depressing chart ever" for asset managers. Andrew Lapthorne, chief quantitative strategist at Societe Generale SA, pointed out that over the last two years, barely one in five stocks globally have managed to beat the S&P 500. Here is his chart again, for those who didn't see it: 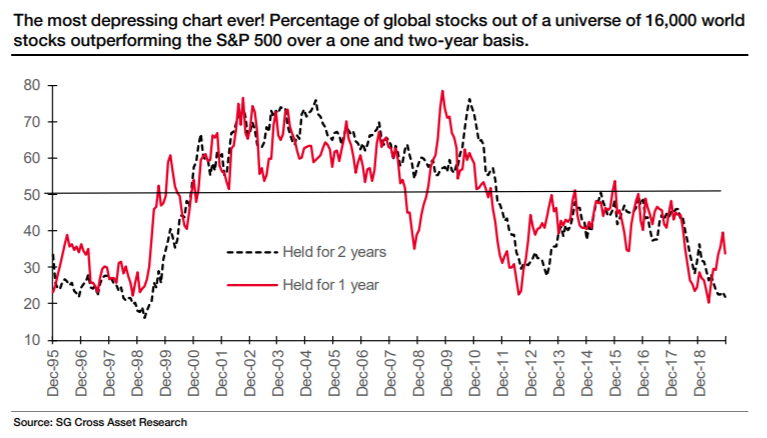 This made brutally clear the difficulties for active equity managers, judged these days against the ever-rising tide of money flowing into passive index funds. As Lapthorne pointed out, S&P stocks have the advantages that they can be easily hedged using derivatives, and boast the protection of the Federal Reserve, which seems determined not to allow a major fall. They also enjoy the exorbitant privilege of being priced in dollars. Yet despite all of this, I am now inclined to say that this wasn't, after all, the most depressing chart for active fund managers. My new candidate will come at the bottom of this piece. For now, let me take you through the arguments why this one wasn't as scary as all that. Tom Nelson, senior vice president and director for portfolio management at Franklin Templeton, made the following very reasonable point about the relative performance of the U.S. market and the MSCI ACWI Index of global stocks excluding the U.S. "With the S&P having returned roughly 10.5% and the ACWI ex-US up less than 1% (net total return) over the last two years, you will naturally have a low hit rate when comparing the average global stock with the S&P." Fair enough. Lapthorne's chart was showing that big-cap U.S. stocks have had a great two years; it was open to active fund managers to invest in them. For those managers whose mandate barred them from investing in S&P stocks, their clients would be unreasonable to complain. Nelson also ran a screen on the Bloomberg, looking at how many stocks in the MSCI ACWI Investable Market Index (covering all emerging and developed markets) had beaten the S&P. He found the following: the hit rate on outperformance of members of the index outperforming the S&P is 37% and 30% respectively in the 1 and 2 year period while outperformance hit rate against the ACWI IMI index itself is 43% [over the last 12 months] and 40% [over the last 24 months]. If you further parse that universe into US stocks and non-US stocks then compare the hit rate of US stocks vs the S&P and non-US stocks to the ACWI ex US IMI, the hit rate [over the last 2 years] is 35% and 47% respectively. Thus better hit rate for Intl vs US which makes sense for a number of reasons. And further converting all Intl stock total returns to USD and comparing to the index (which is USD based) the 2-year hit rate is 43%. So on this basis, the chart need not be that depressing — beyond the well-known fact that U.S. stocks have been beating the rest of the world for a while now. As they continue to attract more flows in pursuit of strong performance, so the seeds of eventual U.S. underperformance should be sown. There is a chart that is far more depressing for active equity managers. It comes from the work of Hendrik Bessembinder, of the W.P. Carey School of Business at Arizona State University, which was pointed out to me by the investment veteran Ewen Cameron Watt, to whom many thanks. Bessembinder has also published some research on the chances of individual stocks beating the S&P, and in the long term it shows that the phenomenon is even more acute. Beating the S&P 500 is the least of their problems. Of the stocks available to buy in and since 1990, 56% of U.S. stocks and 61% of equities in the rest of the world have failed even to beat the return on cash — as represented by the return on one-month Treasury bills. Meanwhile, the top-performing 1.3% of companies accounted for all of the $44.7 trillion in global stock market wealth creation from 1990 to 2018. Outside the US, less than 1% of firms account for $16 trillion in net wealth creation over that period. The phenomenon dates back even further. For the U.S., Bessembinder and his colleagues looked at how many stocks have beaten T-bills over their lifetime, starting in 1926. They found that four out of every seven common stocks in the Chicago Center for Research in Securities Prices database since 1926 have lifetime buy-and-hold returns less than one-month Treasuries. Put differently, the best-performing 4% of listed companies explained the entire net gain of the U.S. stock market since 1926. All the others between them did no more than match T-bills. Put in a more technical way, stock pickers faced a classic difficult distribution, with very thick tails — large proportions of their potential investments doing much better or much worse than the mean: 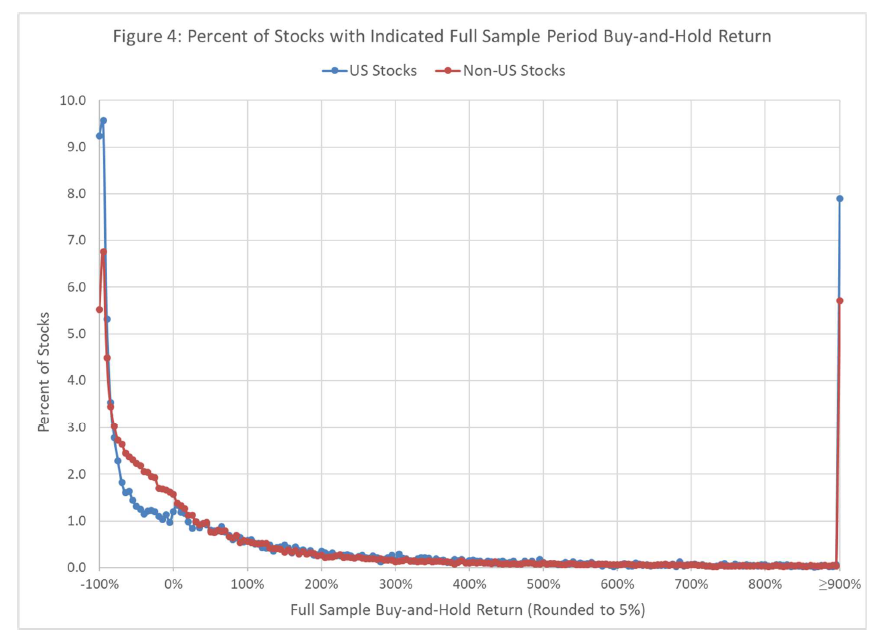 Peter Lynch, the legendary fund manager, used to talk about looking for "ten-baggers" — companies that multiplied 10-fold. This chart shows that was sensible. There are quite a number of ten-baggers to be found, even though they are a tiny proportion of the universe of opportunities. But it isn't so much that finding a ten-bagger will make you rich. It is more that in the long term, the only way to do significantly better than cash is to find a few ten-baggers. These numbers have nothing to do with the dynamics of the S&P 500. They suggest: - Active investing is a horrendously difficult job, and
- Active investors do their job much better than many realize.
If we were to think of active managers as throwing darts at a board to choose their stocks, far more than 90% of those they might hit at random would fail to give them a return better than cash. Active managers who have even managed to beat cash over time have done a decent job.
The Myth of Capitalism Bessembinder's chart also tells us something about the innate savagery and cruelty of capitalism and creative destruction. Most who get as far as setting up their own company and floating on the markets will fail; the few who win, win big. Many think they see an opportunity, but only a few get to take advantage. That brings us to "The Myth of Capitalism: Monopolies and the Death of Competition," by Jonathan Tepper and Denise Hearn, which is the current selection in the Authers Notes Bloomberg book club. I will be discussing it with the authors on Wednesday, starting at 11 a.m., New York time. You can join in on the terminal by going to TLIV. To comment or ask questions before or during the discussion, send an email to authersnotes@bloomberg.net. It is a great, polemical book, attacking the lack of competition in contemporary capitalism, and arguing that without competition, capitalism dies. This, it strikes me, is a built-in flaw in the capitalist economic model. In any given environment, all players want to achieve dominance. They can do that by beating the competition, and then enjoying monopoly rents, or colluding with them, and then enjoying monopoly rents. This is the natural incentive. The huge rewards for the few who win ensure that enough people are prepared to play the game. As the book chronicles, antitrust enforcement has been pathetically weak in recent years. Inequality and all the other ills of contemporary capitalism have risen. But is this a bug that can be fixed with better government regulation, or an inherent flaw? The Bessembinder research suggests that it may well be the latter. Either way, I suspect the "myth" of capitalism is that it can somehow be counterposed against government regulation, or that there is a choice between markets and governments. Left to their own devices, markets shower rewards on a few winners, and force everyone else out. Greater intervention by governments turns out to be the only way to ensure greater competition. That intervention need not necessarily be so much greater than that of a referee in a game, ensuring that the rules are followed. But without such enforcement, athletes' competitive energy can turn into an ugly spectacle. So, is the acute lack of competition in many sectors of the economy a symptom or an intrinsic defect? And is it a myth that capitalism will ensure competition without a vigorous and intrusive referee to enforce the rules? All thoughts and contributions gratefully received. Like Bloomberg's Points of Return? Subscribe for unlimited access to trusted, data-based journalism in 120 countries around the world and gain expert analysis from exclusive daily newsletters, The Bloomberg Open and The Bloomberg Close. | 

Post a Comment