Markets should mind their p/es and qs In the very long term, stocks are driven by fundamentals – economic growth, earnings, and assets. That is why valuations comparing share prices to various slowly changing trackers of fundamentals are taken seriously by asset allocators. But what happens when we revise the fundamentals? And how can fundamentals even be measured in an era where assets tend to be ever less tangible, and to be tied up instead in more nebulous qualities such as intellectual property and brands? That issue now confronts the measure known as Tobin's q – a concept coined by the Yale University Nobel laureate economist James Tobin which refers to the ratio of a company's market value to the replacement value of its assets. Over history, the London-based economist and asset manager Andrew Smithers, author of the classic tomes Valuing Wall Street and Wall Street Re-valued, has shown that q is the most effective long-term valuation metric, followed by the cyclically adjusted price/earnings multiple (CAPE) now widely associated with another Yale Nobel laureate, Robert Shiller. Neither measure is of any use for timing, but they both do a great job of predicting subsequent returns over 10 years or longer. In this chart "hindsight" (the blue line) indicates what returns actually were generated over the next 30 years from each date, while the other lines show the predictions generated using q and CAPE: 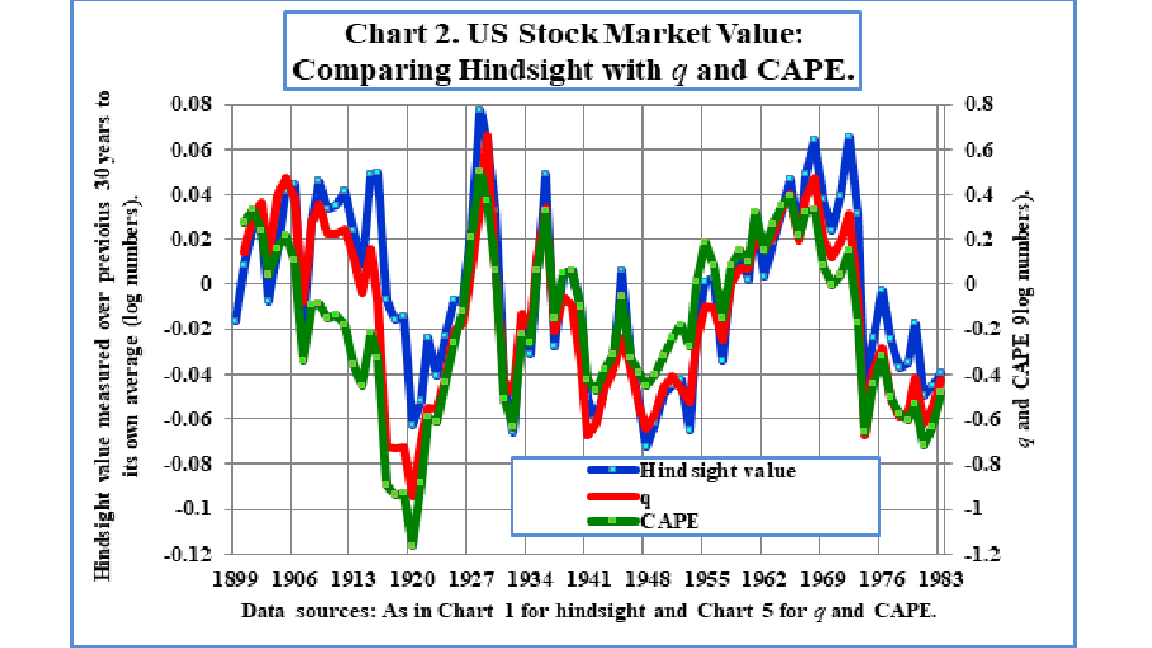 Both are startlingly accurate, but q has worked better. This may well be because CAPE relies on numbers produced under accruals accounting, which might be systematically distorted. But recently, the National Income and Product Account (NIPA) numbers that make up the denominator in q, produced by the Bureau of Economic Analysis as part of the national GDP numbers, received a drastic revision. This is Smithers' summary of the main changes:  The result is to reduce U.S. non-financial companies' net worth by 58%. The lower denominator means that q now shows the stock market to be more overvalued compared to history than CAPE does. This is Smithers' chart incorporating the revisions: 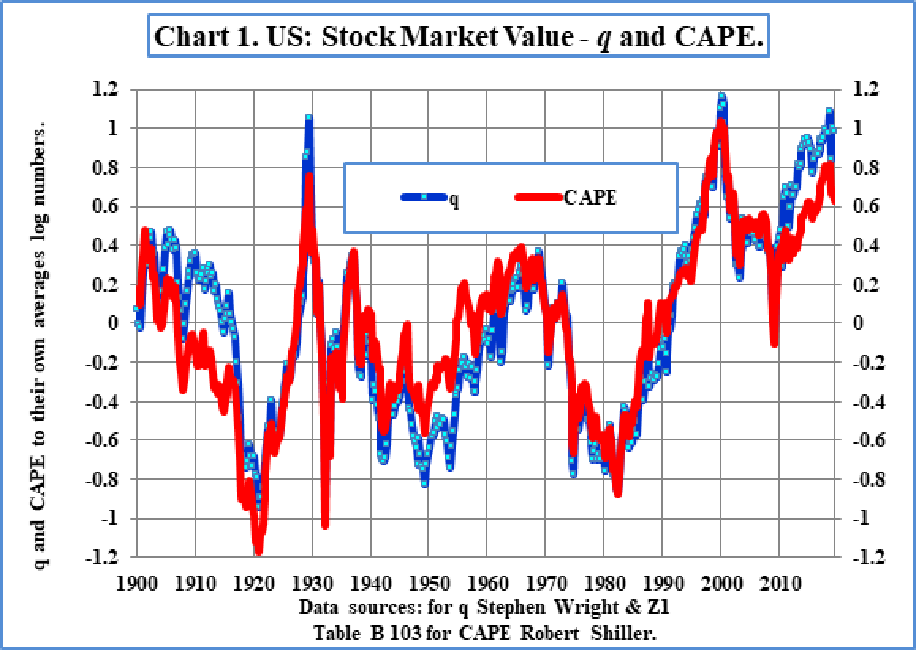 And this is the same chart, produced by Smithers in 2017 before the revisions came into effect. At this point, CAPE showed a more serious overvaluation than q did: 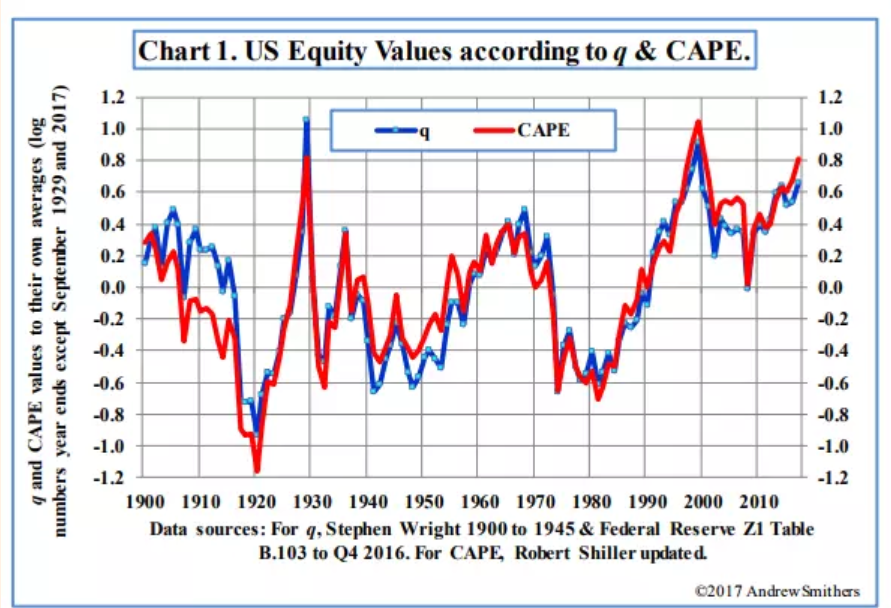 If you feel bearish, this implies that U.S. stocks are even more overvalued than we thought. By Smithers' calculations, non-financial companies were overvalued by 88% according to q at the end of the second quarter before the revisions. Post-revision, that number rose to 167% overvaluation. If you feel bullish, however, the fact that the denominator can be so widely revised raises questions over its usefulness. The historical record of q as a great indicator brooks little argument; and the BEA statisticians are trying to keep up with the changing nature of assets. It would be unwise to ignore the warning signal from a high q. But it is not a finely tuned measure. And everyone should mind their debt A nasty implication of the NIPA revisions is that U.S. companies are far more leveraged than they previously appeared. This chart, from Smithers, shows gross and net debt as a proportion of net worth under the previous numbers, and under the revisions. 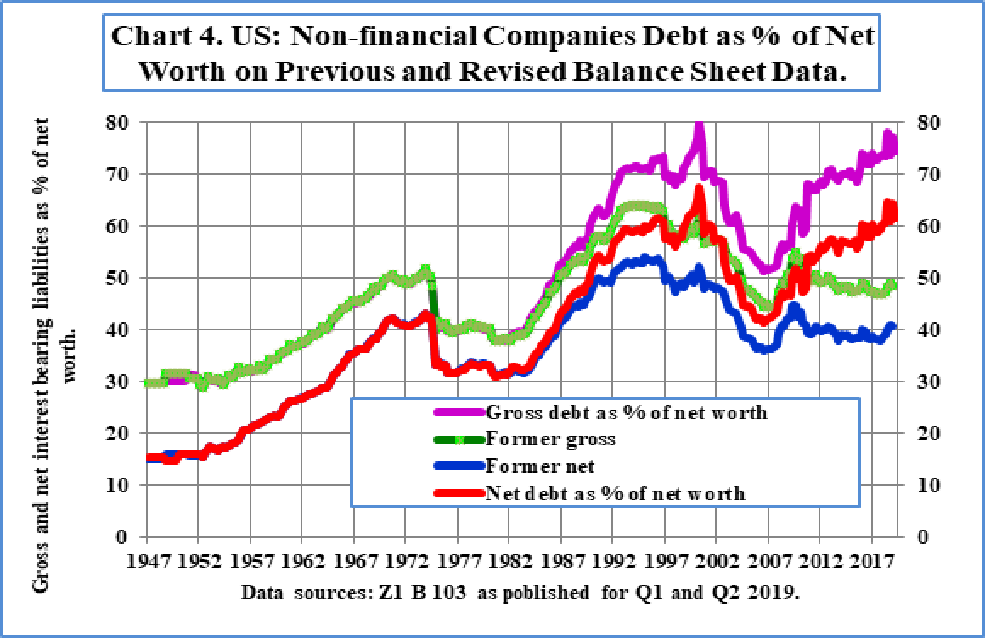 Suddenly leverage appears to have returned almost to its post-war high set during the dotcom bubble. That is alarming. And it has, indeed, caused alarm. One finding of the Bank of America Merrill Lynch fund manager survey, which I covered yesterday, is that investors have changed their preference on how companies should use cash flow. Throughout the post-crisis years, they have wanted more capital expenditures or cash distributions to shareholders. In the last 12 months, this has been replaced by an ardent desire for companies to clean up their balance sheets: 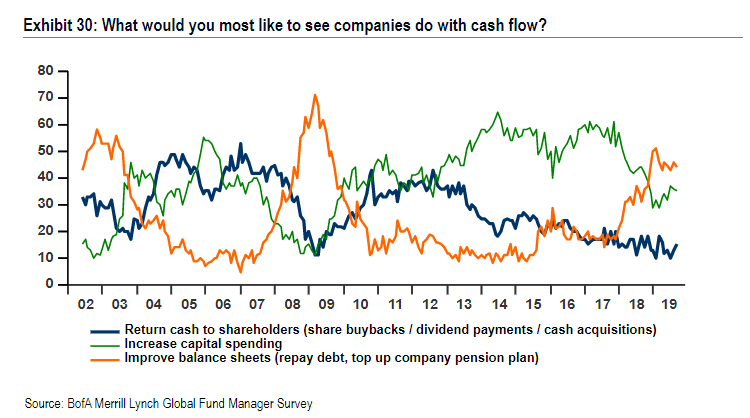 An analogue to the rising concern about leverage can be seen in the strong outperformance of quality stocks over the last two years. The "quality" criteria generally include a clean balance sheet. This is how MSCI's U.S. quality index has performed compared to the main market over the last three years: 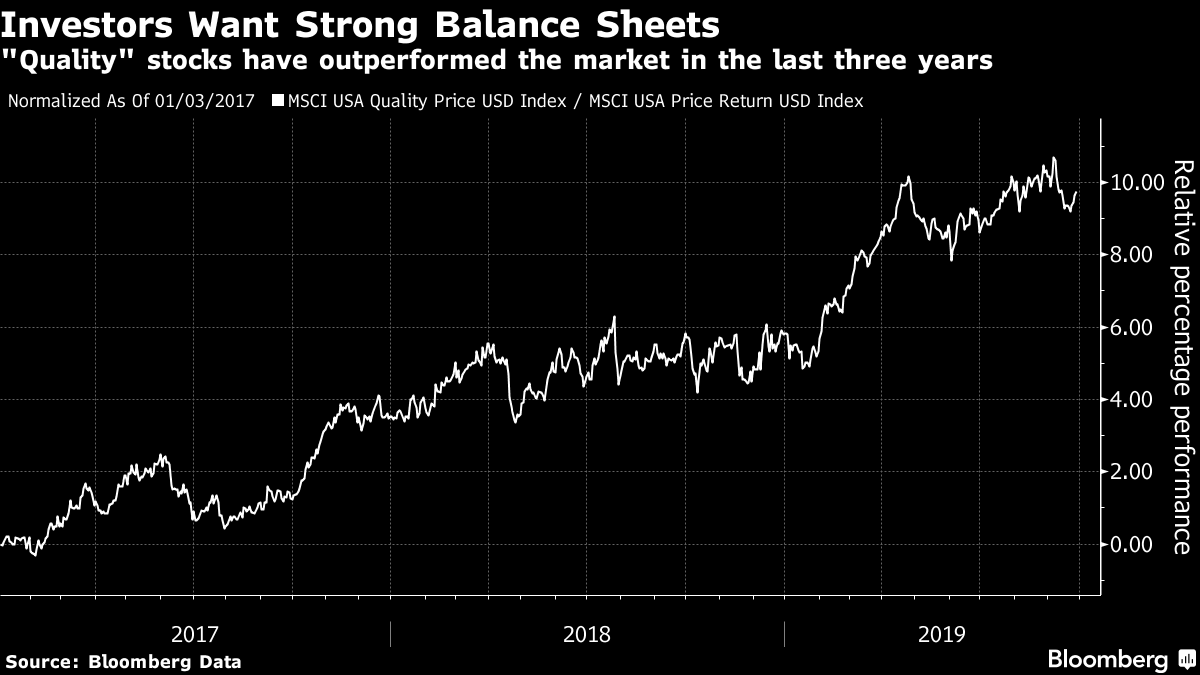 But while credit concerns show up in the relative performance of stocks, they do not show up in high-yield credit itself. The Bloomberg index for Ba- and B-rated debt has roughly kept pace with small-cap equities over the last three years: 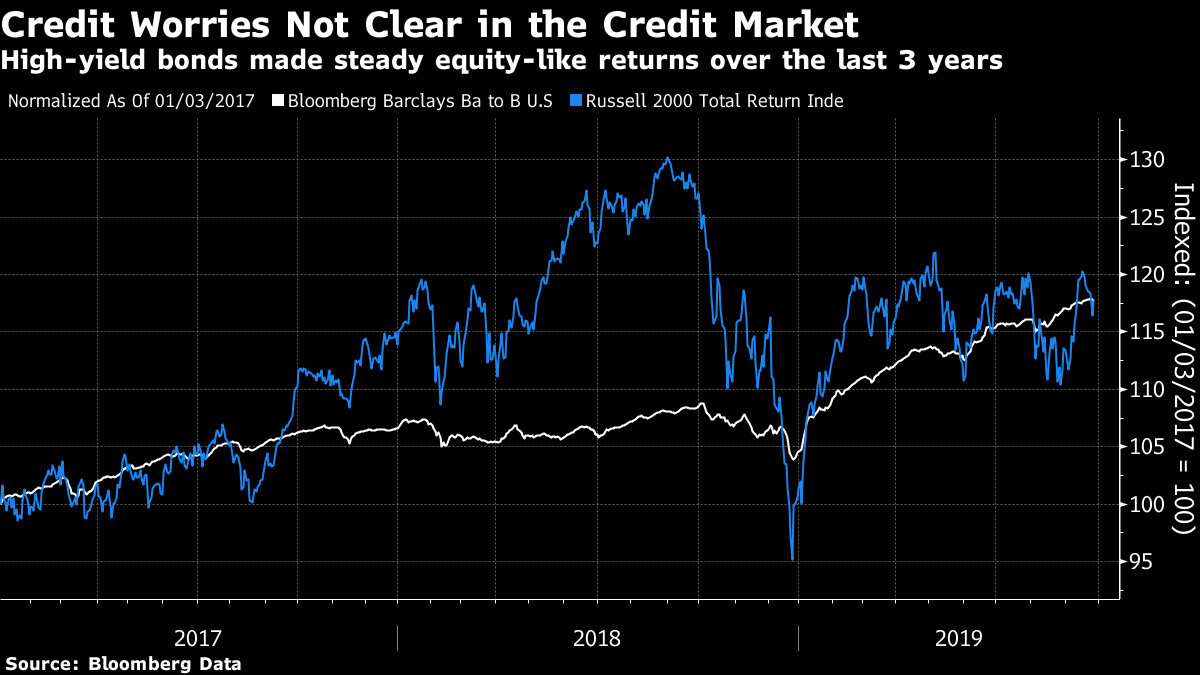 In practice, leverage is a concern for a significant but outnumbered minority of investors at present. According to Absolute Strategy Research's regular poll, about 16% of big investors make up a Credit Risk group that "does not expect inflation to slow but instead sees credit underperforming. This credit risk leads them to expect equities to de-rate on falling earnings and see a bear market as quite likely." These investors believe there is safety in emerging markets (in an inflationary environment), and also trust gold.
If leverage is as scary as the new NIPA numbers suggest, we can expect this group to grow. Like Bloomberg's Points of Return? Subscribe for unlimited access to trusted, data-based journalism in 120 countries around the world and gain expert analysis from exclusive daily newsletters, The Bloomberg Open and The Bloomberg Close. | 


Post a Comment