Now That's What I Call a Financial Mess 2007-08 Markets coverage over the last few days has been like playing "Financial Markets' Greatest Hits – 2007-08." Last week brought a huge momentum reversal and factor meltdown, just as the quants suffered in the summer of 2007. This week brought an epic spike in repo market rates in a replay of events that prompted the New York Fed to intervene twice back then for the first time in a decade. 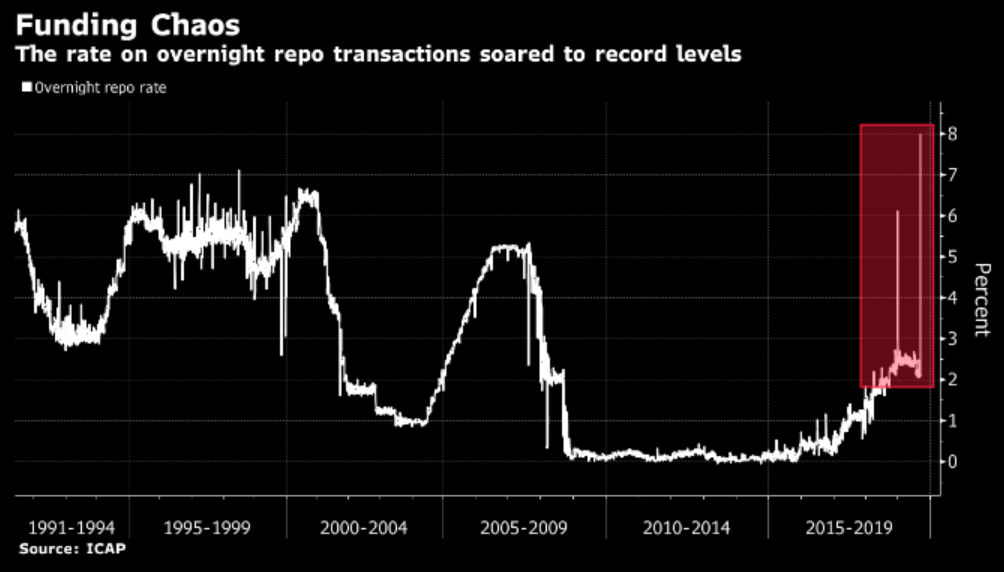 It's a rule of thumb that if you're even talking about such geeky fare as long-short market-neutral strategies or overnight repurchase agreements, thensomething has already gone wrong. While these two events didn't cause each other and happened in different markets to different people, it's no coincidence that they happened at the same time. Both resulted from extreme conditions in bond markets. It doesn't necessarily follow, however, that we're doomed to stage a full-volume repeat of the financial disasters of 2007-2008. The causes are different. In the repo market, players borrow cash overnight, offering very secure bonds as collateral. A decade ago, the problem was that banks no longer trusted each other's credit, or the strength of the collateral, so the market froze. It was an inverse bank run. Rather than everyone rushing to take their money out, nobody during the Lehman crisis wanted to put money in. This time the issue is a supply-demand mismatch. The Fed has steadily reduced the supply of money in recent years. Meanwhile, the government has been removing money from circulation by issuing bonds. And banks want to hold on to cash because it's time to pay corporate tax bills. Put all these factors together and banks are more reluctant to lend, so need much higher rates to be persuaded. That on Tuesday gave us an extraordinary overnight rate of almost 8%, the highest on record. Banks are less reliant on the repo market for funding than they used to be, so there's no great reason to expect leveraged losses. The quants should also be less seriously affected than in 2007. The number of investment groups using leverage to pursue factor investing has reduced over the last decade. That doesn't mean we can ignore these events, which show that liquidity can dry up swiftly in an environment where many borrowers expect to be paid (via negative interest rates) for the privilege of borrowing money. Dollar-funding difficulties may soon be a problem. With rates so low, borrowers globally have been accumulating dollar-denominated debt. This chart from London's Absolute Strategy Research shows that emerging markets outside China are more exposed than ever: 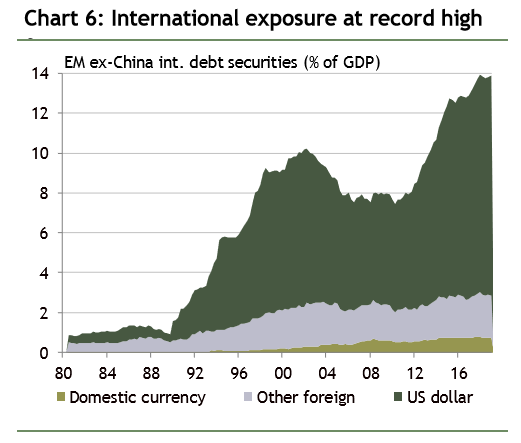 There are also sign of stress in cross-border currency swaps, suggesting intensifying difficulties for foreign borrowers. This incident has brought the Fed's effective rate to the top of its 25-basis-point range for the first time since the tightening campaign started in 2015: 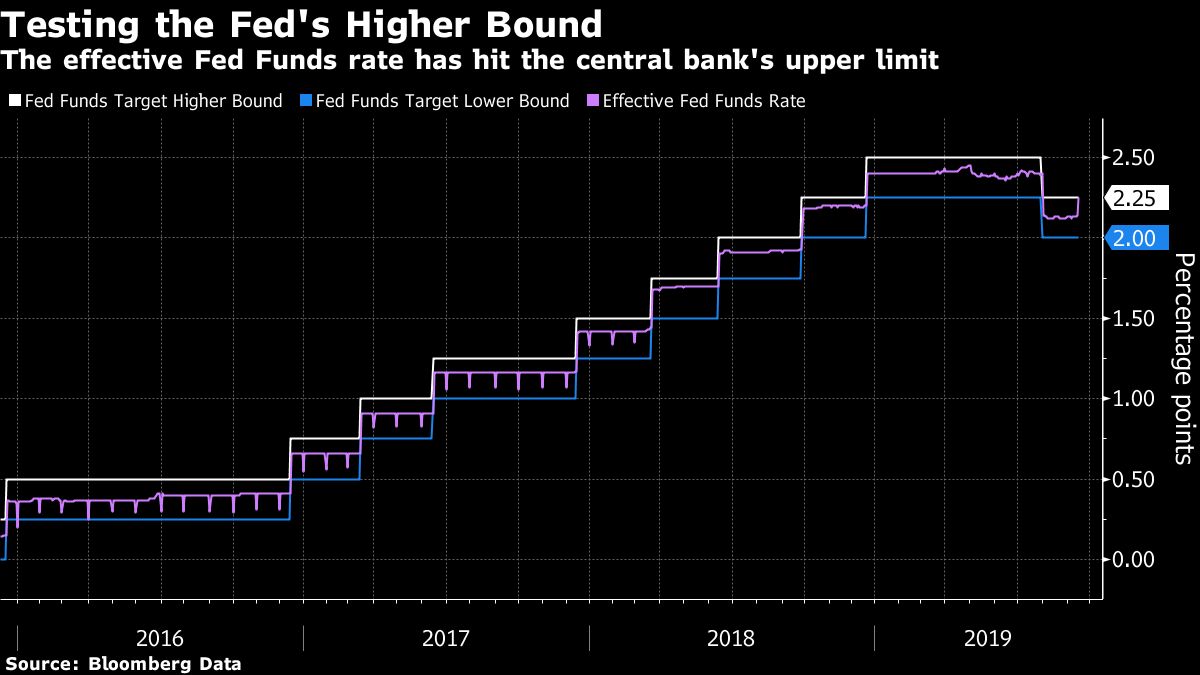 The Fed cannot be seen to lose control over money markets. The Federal Open Market Committee may need technical and innovative measures to keep the markets in check. Just like in the early months of the 2007-08 crisis. Economic Growth Status: It's Complicated Wednesday will see two big economic events. The FOMC meeting will result in a cut of 25bps to the Fed Funds rate. The other has been less publicized, and is far less market-sensitive, but I encourage readers to pay attention. Ricardo Hausmann of Harvard University's Kennedy School of Government has made it his life's work to understand why some economies grow faster than others, and therefore which countries are likely to grow next. He believes the answer lies in economic complexity. To paraphrase, countries that develop complex industries with transferable skills are able to grow much faster. Countries that do nothing more than extract raw materials and don't diversify (like Hausmann's native Venezuela), have little chance of growth. Those that develop know-how and businesses that lead to others (think South Korea) are better placed. This is laid out in the Atlas of Economic Complexity, which aims to show which businesses are linked to others, and which countries therefore have the most complex economies. Hausmann's team is now launching a tool with 130 separate country profiles. Their launch presentation will be shown live on Wednesday here. It's a gloriously interactive tool, explained in this video. Most of us will spend much of the next 24 hours reading the latest FOMC statement and accompanying materials. After that, we should spend a lot more time digging into the geography of economic complexity. Like Bloomberg's Points of Return? Subscribe for unlimited access to trusted, data-based journalism in 120 countries around the world and gain expert analysis from exclusive daily newsletters, The Bloomberg Open and The Bloomberg Close. | 


Post a Comment