Welcome to the Weekly Fix, the newsletter that doesn't keep their hands at two and ten when steering the car but hopes the Federal Reserve does. –Luke Kawa, Cross-Asset Reporter
Echoes of 1998. But what's different?
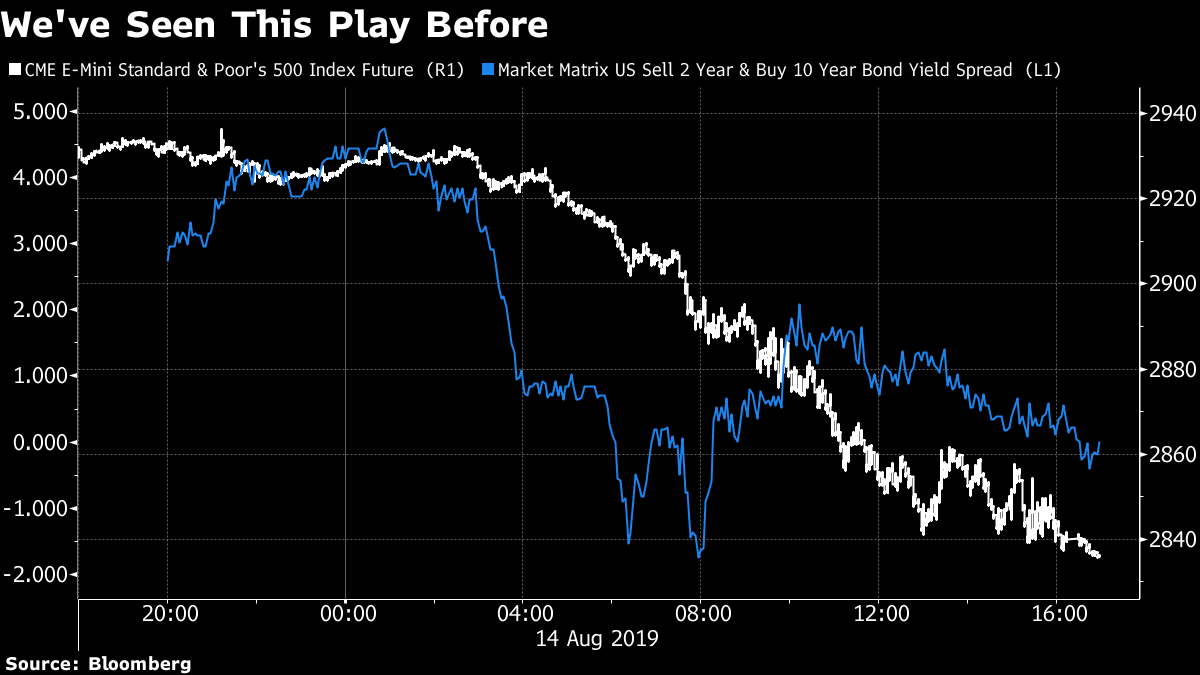
The prolonged "Big Dipper" shape of the Treasury yield curve – with the three-month bill yielding more than the 10-year yield, while the two-year rate remained below the longer-term maturity – finally ended this week with a brief inversion of 2s10s on Wednesday.
This constellation term structure was the best support for the idea that the Federal Reserve could embark upon a "mid-cycle adjustment" without the length or depth of an easing cycle associated with a recession. That narrative now needs to change in a way that has larger implications for the longer-term than shorter-term outlook, in contrast to the purported recession signal amplified by this inversion.
In fact, the nature of this inversion makes it an anti-recession indicator, based on the most recent historical experience. However, the limited sample size of recessions means that any of these surface-level analogs lack the statistical rigor to set your watch to, and ought to be taken with the whole salt shaker – not just a grain.
A bull-flattening into inversion, with long-term rates sinking faster than short-term tenors, last occurred in 1998. The confluence of the Asian currency crisis and LTCM's implosion elicited aggressive accommodation from the Federal Reserve. The tightening in financial conditions was reversed, and global chaos didn't spill over to domestic shores until the central bank had resumed a tightening cycle and the dot-com bubble ultimately burst.
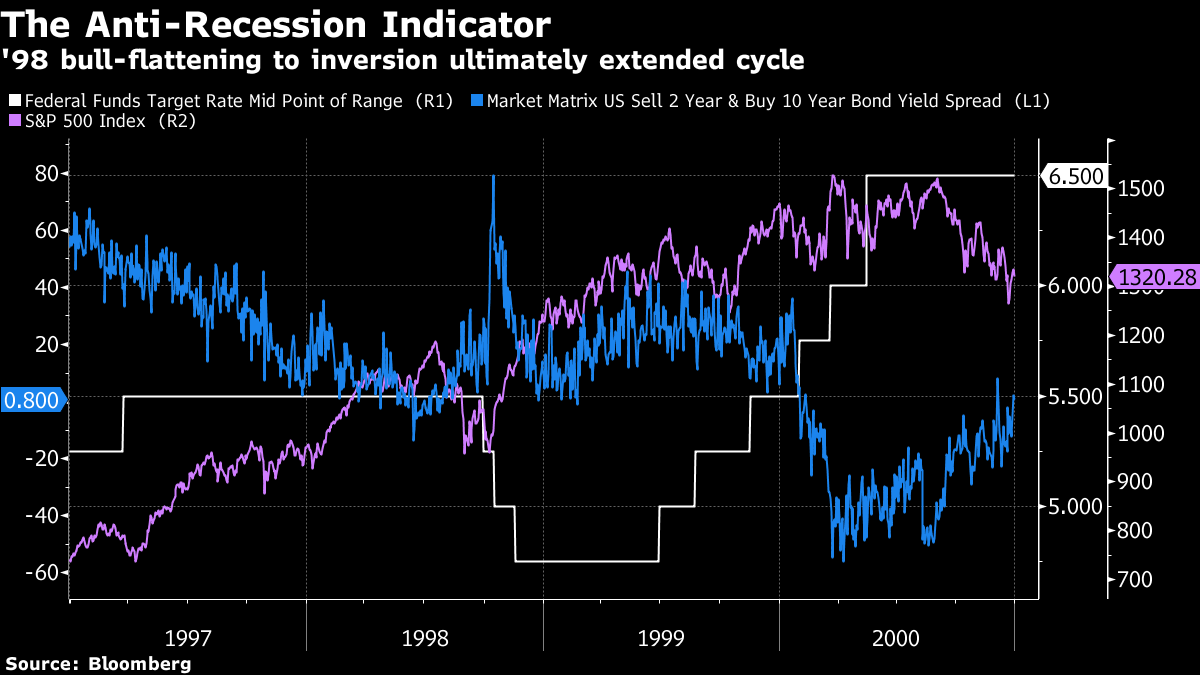
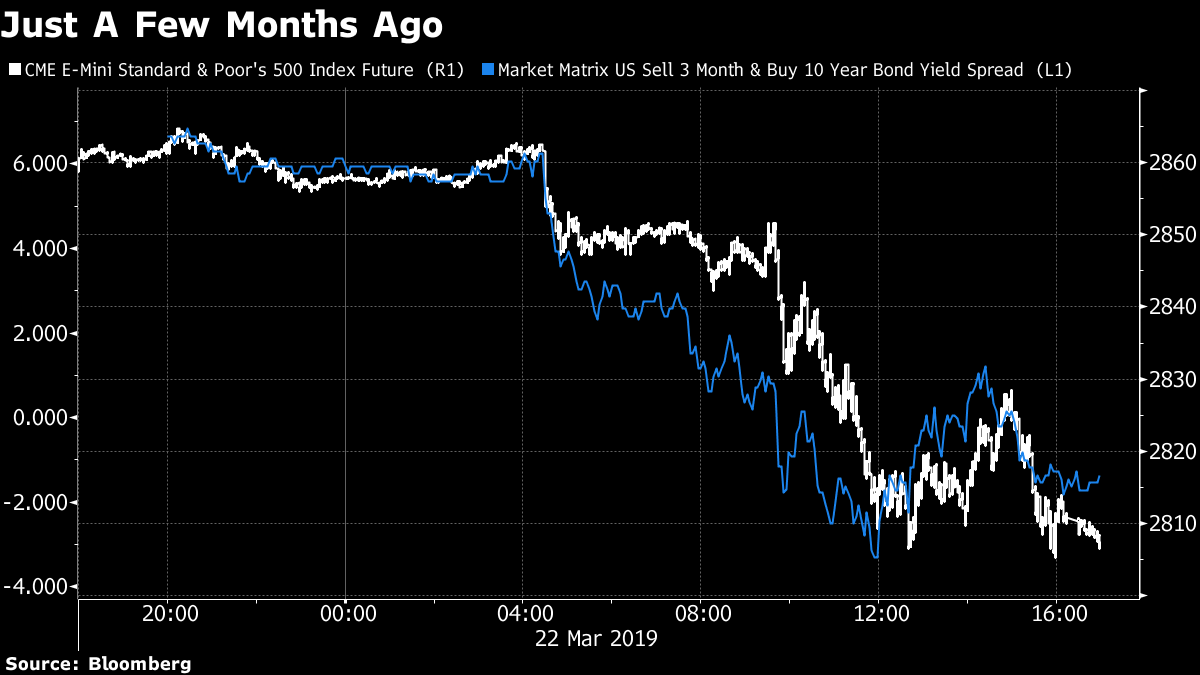
If this sounds familiar, it's because we wrote the same thing in March when the three-month, 10-year spread inverted. And RBC economist Tom Porcelli also used CTRL-C and CTRL-V this week to reiterate some thoughts from a few months ago:
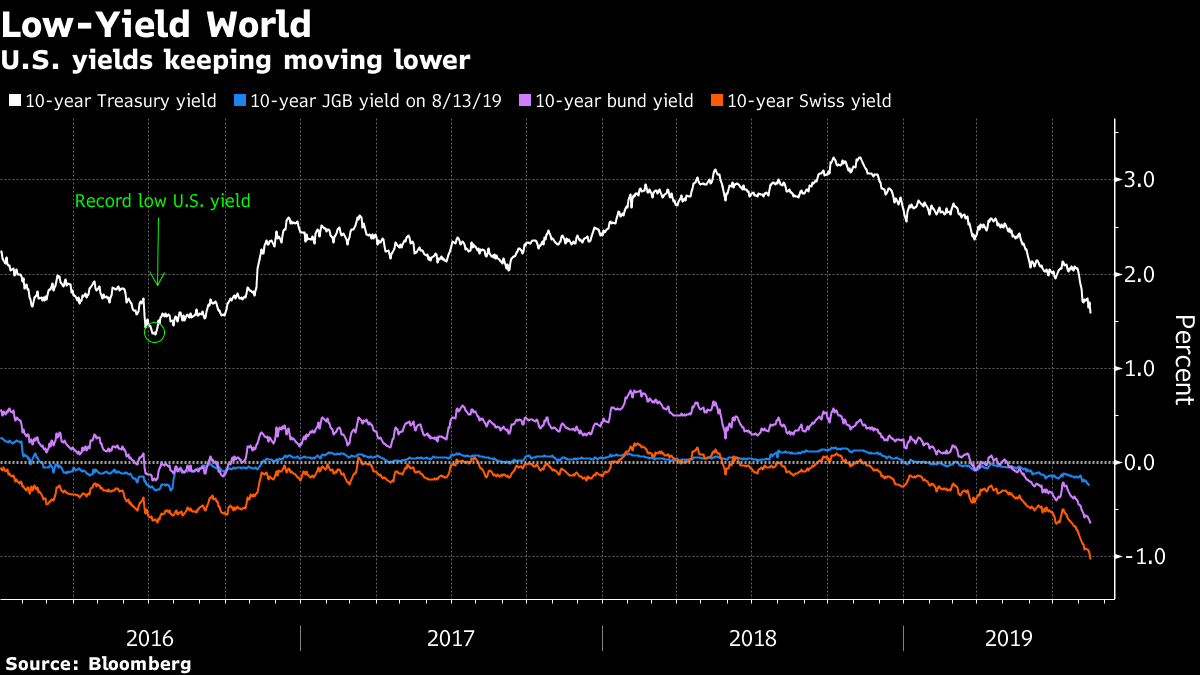
Yields have become more a function of global growth dynamics and indeed have become anchored to low/negative sovereign yields abroad. What this means is the United States is able to finance relatively good rates of domestic growth at globally suppressed interest rates. This type of dynamic has historically been very positive for asset inflation (it was a big reason why the housing bubble was allowed to form – recall the interest rate conundrum last cycle) and inflation in general in the 1970s. So, no, we are not on recession watch because of this dynamic. In fact, the fundamentals (especially on that 70% slice of the U.S. economy known as the household sector) continue to argue for a protracted expansion.
Then again, this is not 1998: lackluster aggregate demand – a consequence of inequality in advanced economies and policy decisions made in Europe and China – is the root cause of the global malaise, rather than financial conditions so tight that they're bringing the globe to its knees. In other words, there's less reason to be optimistic about the ability of rate cuts to improve this situation.
In this sense the inversion is almost more disturbing than a sign of storm clouds fast approaching. It reflects an increased probability being attached to a scenario in which the American economy will catch down to its Japanese and European counterparts for the long haul. It's more secular stagnation than cyclical slump.
And given the underwhelming equity returns in those locales, the drubbing in U.S. equities on the sinking 10-year yield makes a lot more sense – a continuation of the theme that lower rates are no longer a positive for risk assets, in contrast to what prevailed for much of the first half of 2019. Again, we saw the same reflexive selling in March when the 3-month and 10-year yields inverted.
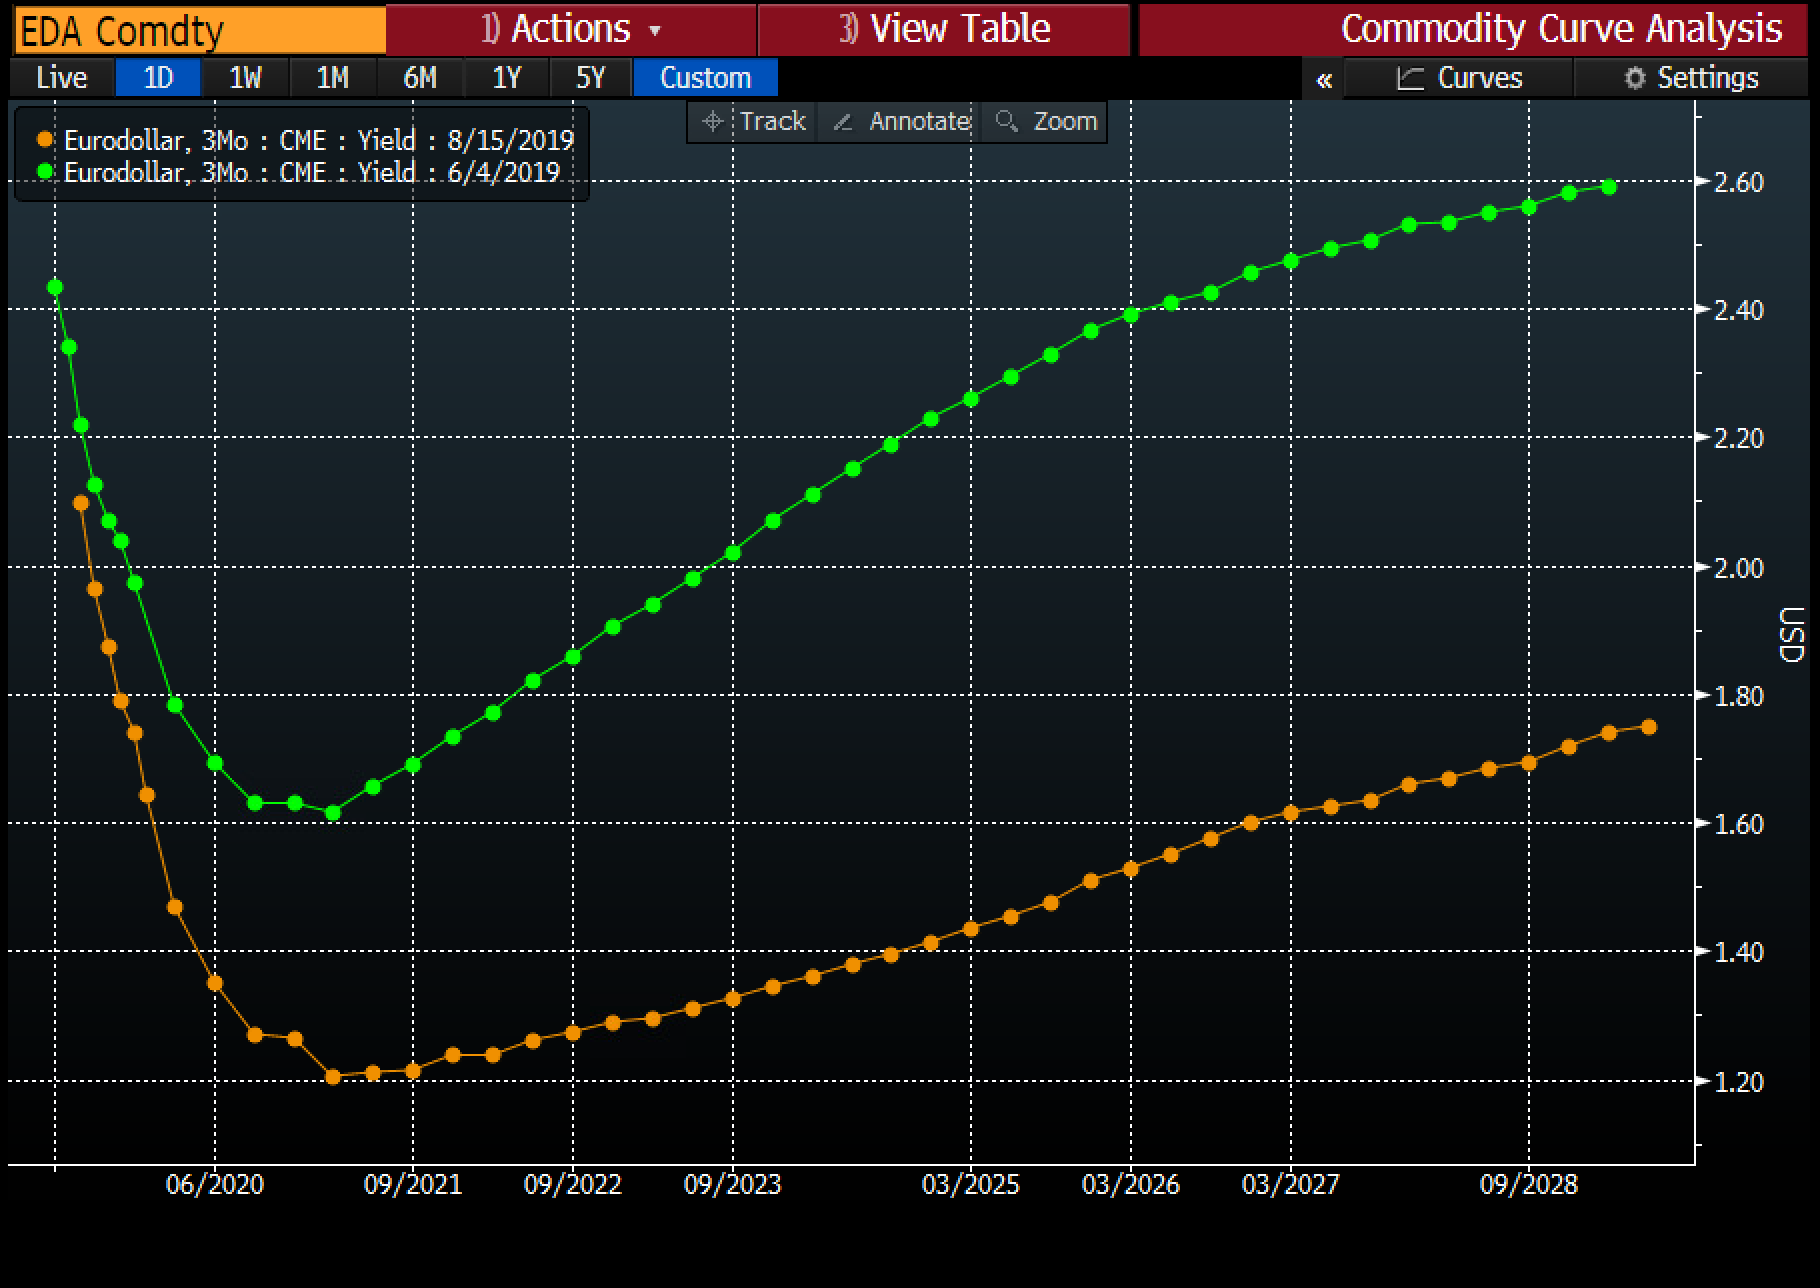
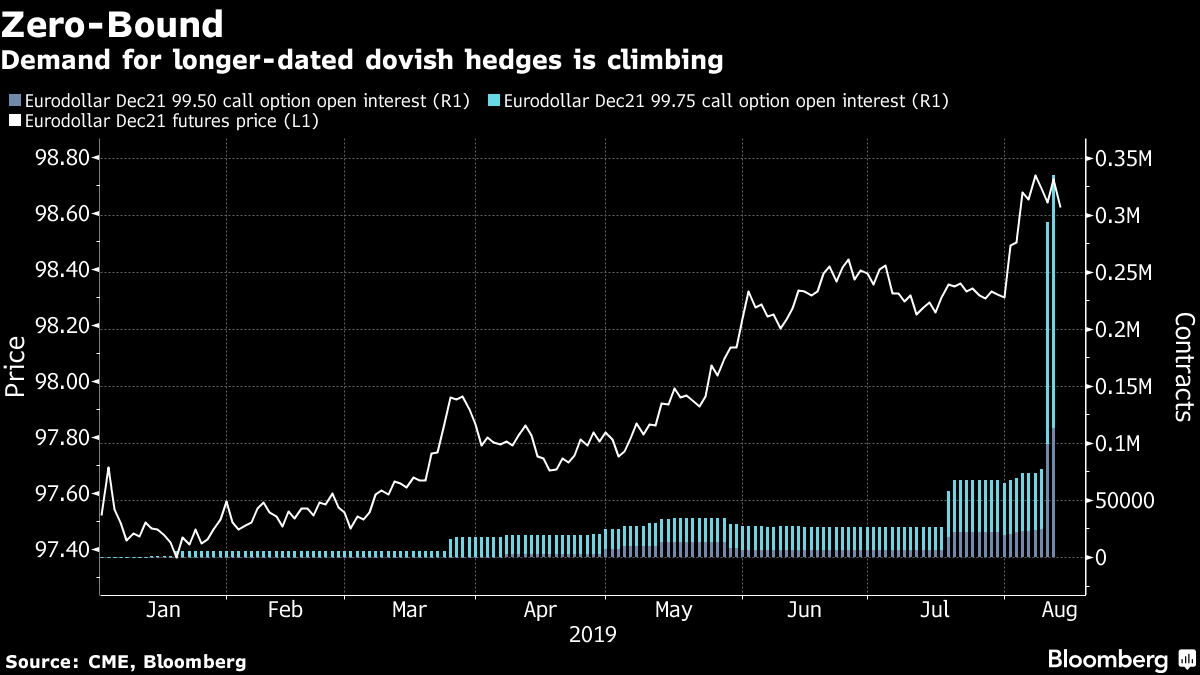
After Fed Chair Jerome Powell's "act as appropriate" in early June, the Eurodollar futures curve pointed to a Fed easing cycle and recovery to rates in the neighborhood of current estimates of neutral within the projection horizon. That's no longer the case: a deeper easing cycle with rates staying lower for longer is now the market-implied base case. Along with this, the degree of twist-steepening implied by forward curves has collapsed.
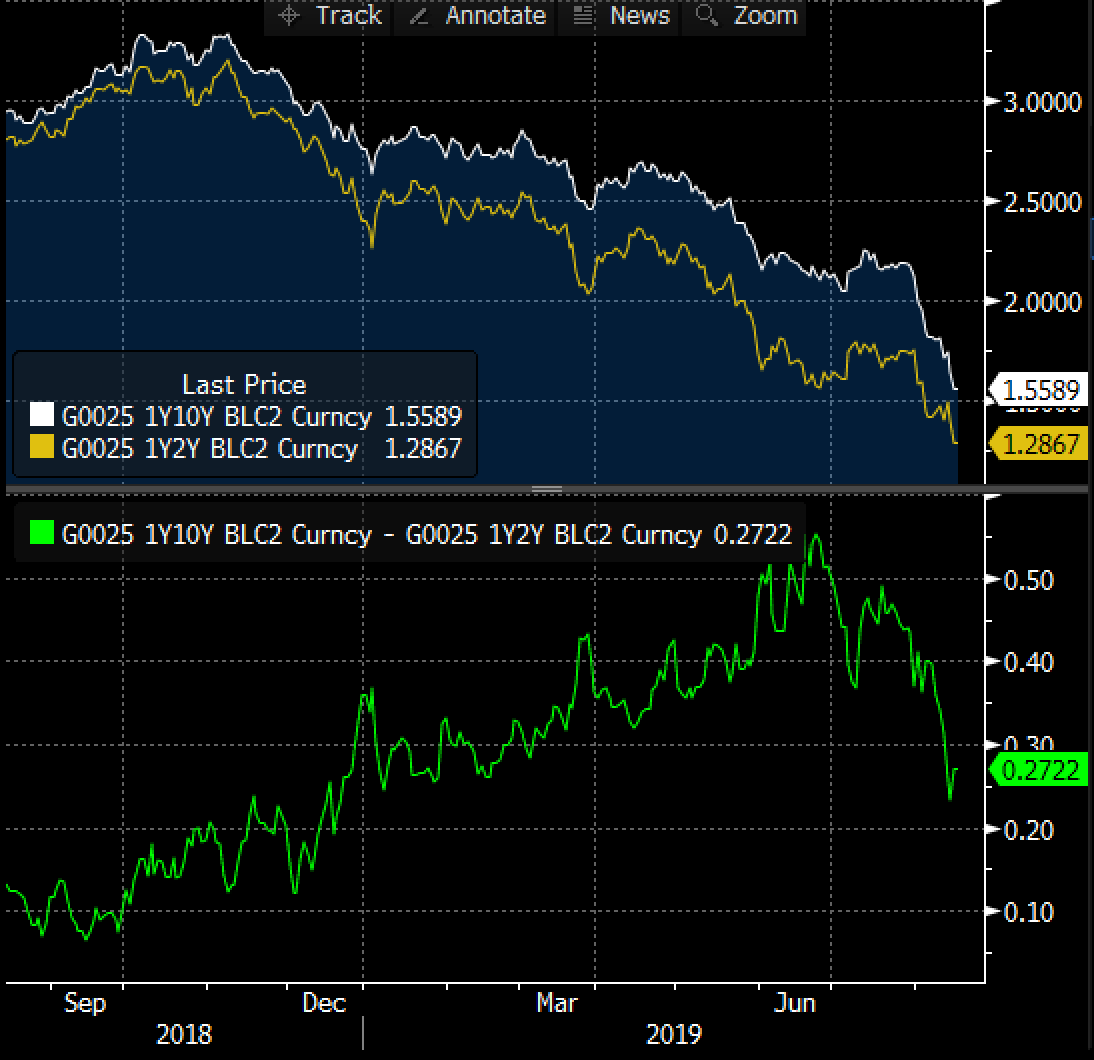
In sum, this week's developments make it more difficult to argue that there isn't a divorce between bond and equity markets. Stocks about 5% off of all-time highs do not comport with a bond market that's pointing to persistently anemic activity.
Panic Buying
The orderly nature of the equity retreat contrasts sharply with the panic buying seen in bonds, including ultras triggering circuit breakers on Wednesday.
Now that the 2s10s inversion has given fuel to recession fears, it's worth wondering how investors might design portfolios to best prepare for such an eventuality.
As someone who talks to traders and strategists in the volatility space frequently, one thing I often ask is if the low level of U.S. Treasury yields helps them when pitching clients. That is, with rates so low, is it easier to talk up the prospective benefits of protection via direct exposure using puts on the S&P 500 versus the traditional embedded diversification provided by a 60/40 stocks/bonds portfolio and the presumption of a negative correlation between the two asset classes?
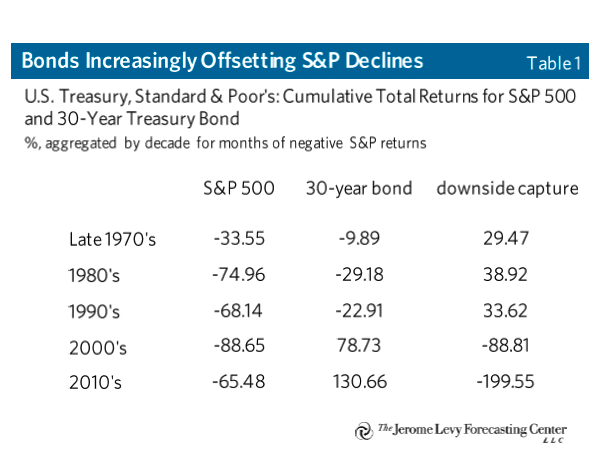
Turns out, this premise might be completely off-base. Bonds have provided incredible protection this year. And Srinivas Thiruvadanthai, research director at the Jerome Levy Forecasting Center, wrote a tour de force report earlier this year that helps explain why.
"One implication of the big balance sheet economy is that stock market declines have greater potential to trigger recessions and destabilizing debt dynamics," he writes. "Unsurprisingly, the downside capture ratio has been most negative in the 1920s, and 2010, both periods during which private sector balance sheets were large relative to incomes."
His analysis shows that long bonds are increasingly offsetting damage done to the S&P 500.
Let's do some back-of-the-envelope math (with the help of this bond price calculator) to estimate how low yields would have to go for the 30-year Treasury to provide a sufficient offset to a material U.S. bear market.
Lawrence Hamtil, financial advisor at Fortune Financial, makes the case that such a drawdown would be roughly 33%. Assuming downside capture from bonds in the same neighborhood of what's happened throughout this decade, that would put the benchmark 30-year yield in the ballpark of 50 basis points if such a risk-off episode were to play out over the next year.
Real 30-year yields are already below there – which throws the Fed's long-term dot into question – and the breakeven curve is still positively sloped.
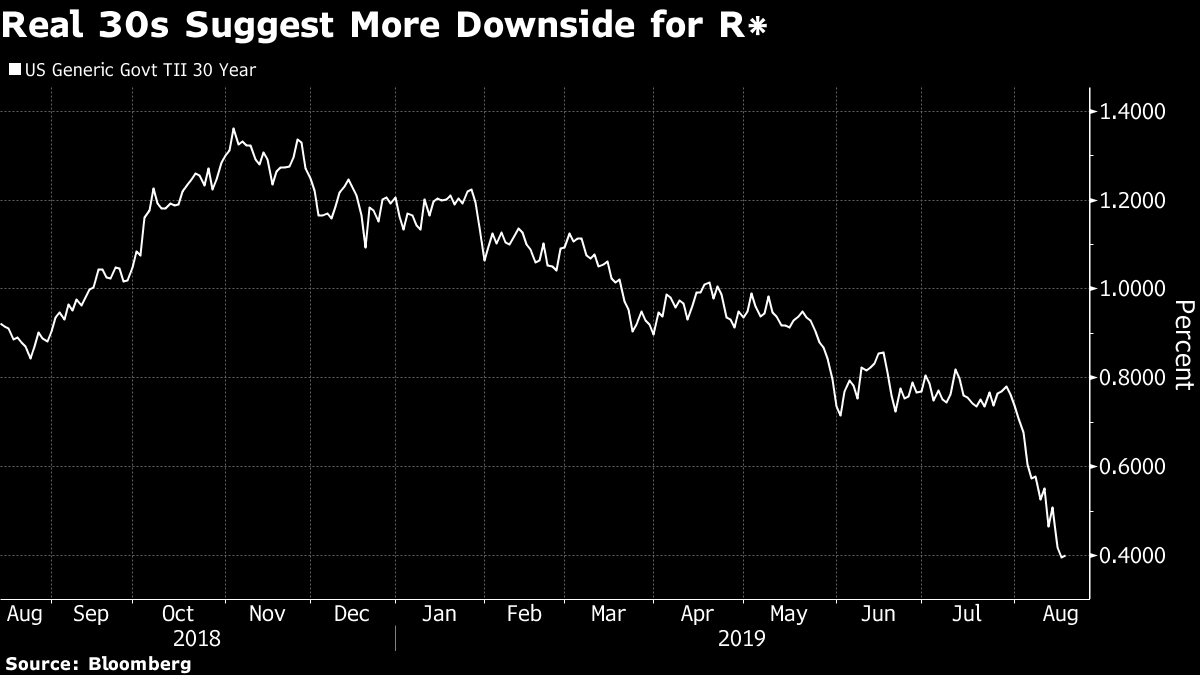
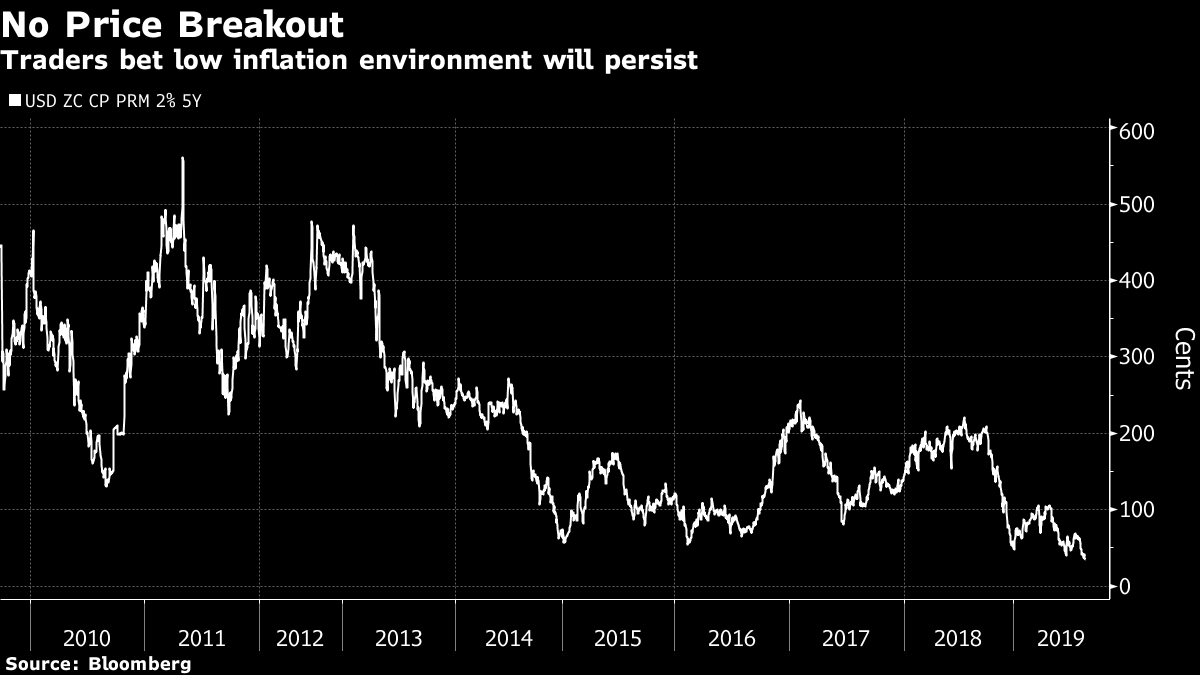
While we acknowledge that uncertainty increases the further one attempts to project the future, one wonders the theoretical justification for such a term structure given changes to the U.S. economy. The biggest source of volatility in headline inflation – oil prices – has an effective cap in the medium-term for as long as U.S. shale remains plentiful. This entails that the variability of inflation may be higher in the short than the long term.
With the cost of protection in the event that headline CPI averages above 2% over the next five years sinking to a record lows, perhaps it's just a matter of time until persistently low price pressures are reflected in market based expectations of inflation compensation throughout the curve.



Post a Comment