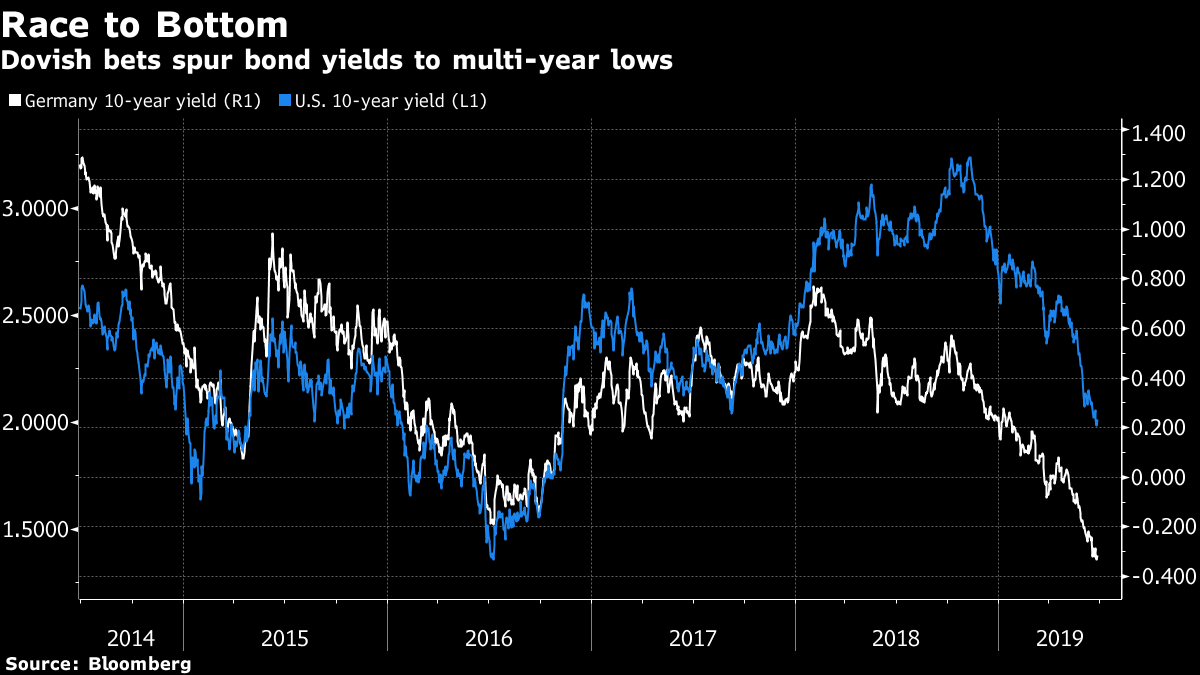
The global version, in bonds, has seen French 10-year yields turn negative, German bund yields plumb fresh record lows, and the convexity lover's favorite – the Austrian century bond – yielding less than 1.2%. Everyone's buying bonds.
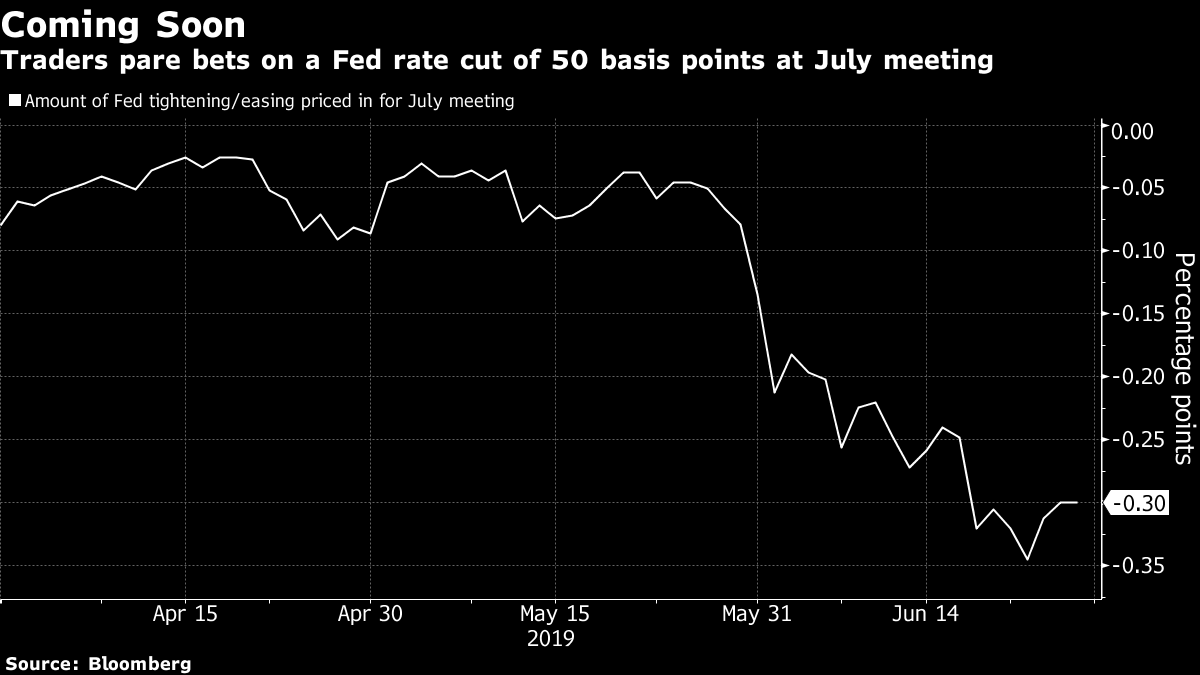
Even if the flows weren't there, the enduring bond rally wouldn't be too hard to understand: global activity is lackluster (including some signs of U.S. weakness), downside risks from trade still loom large, inflation is moribund and global central banks are in easing mode, with Federal Reserve Chairman Jerome Powell reaffirming a lower long-run outlook for rates this week.
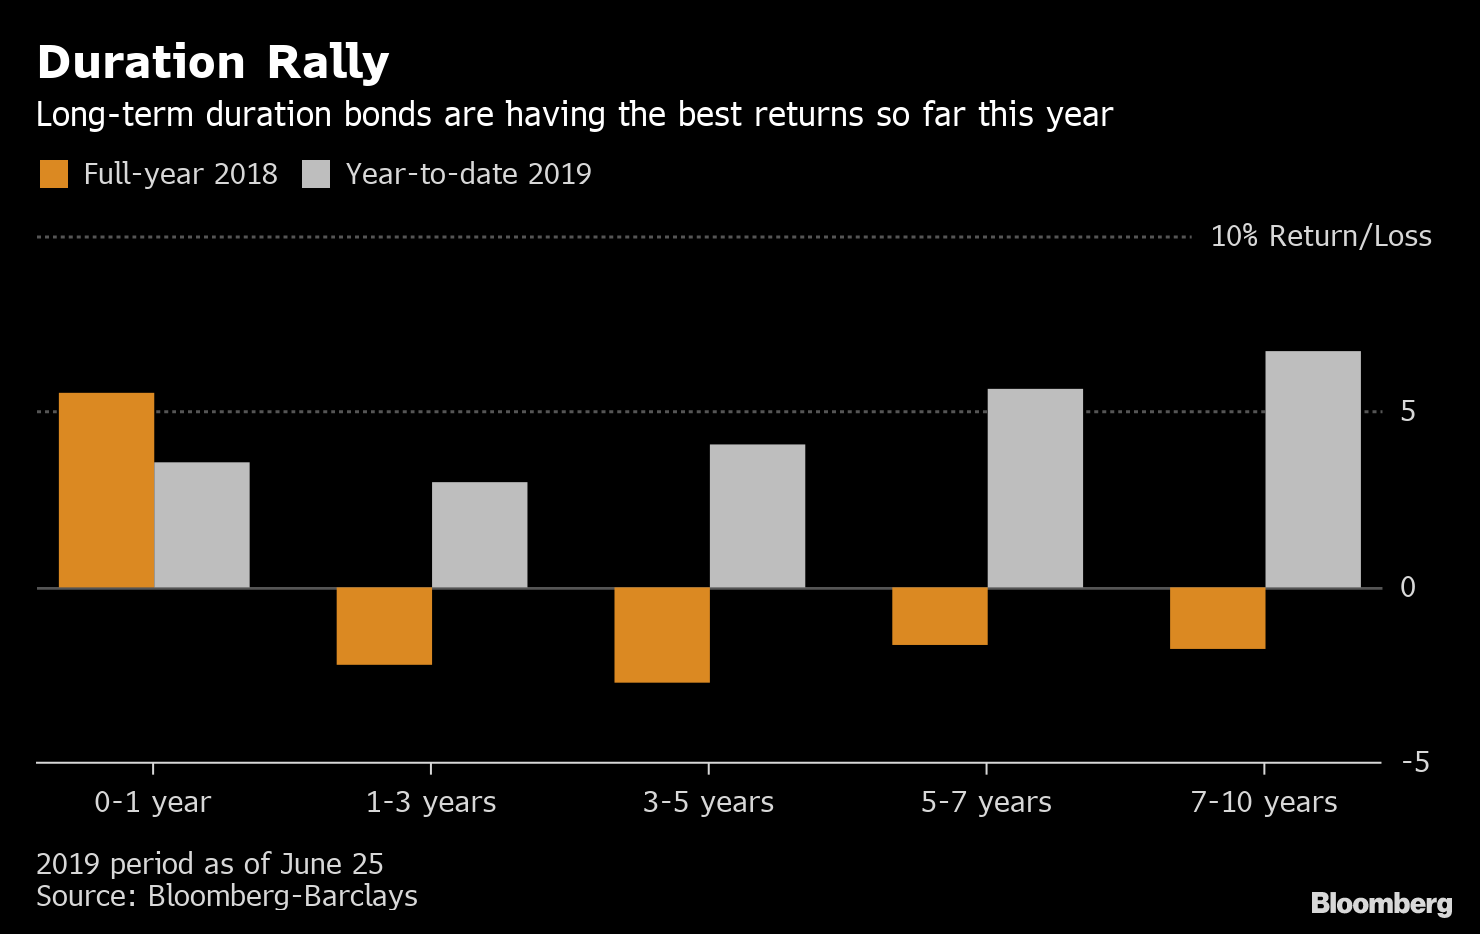
All this makes the 30-year Treasury's inability to book a major advance this month all the more striking. Two-year notes, fives, and 10s have all seen double-digit drops in yields during June.
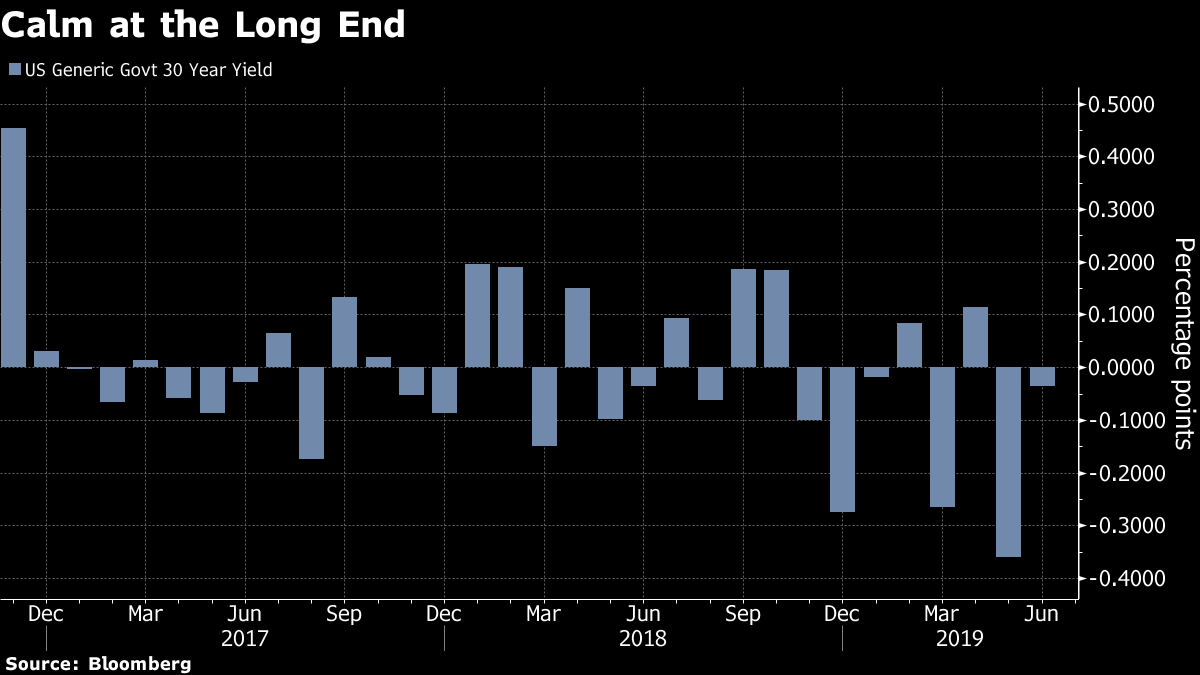
This contrasts with the idea that equity markets are bullish while bonds are signaling deep worries. Add it to the list that includes the Big Dipper and one-year forward curve among signs that the fixed income markets aren't actually pricing in Armageddon, but a rosy outlook.
With regard to anticipated Fed easing, "the 30Y Treasury represents some optimism that they are insurance cuts that will keep the economy growing 2% into the future and we won't suffer any deflationary shock from any decline in activity," said Michael Kushma, global fixed income chief investment officer at Morgan Stanley Investment Management.
The popularity of curve-steepening trades around Wall Street – betting the gap between shorter-term rates and the 30-year will widen – has also put some pressure on the longer maturity, he added. "The twin forces of some degree of optimism and positioning mean that the 30-year is not a sell because of the weakness in the general economy, but it isn't a great buy either," he concluded.
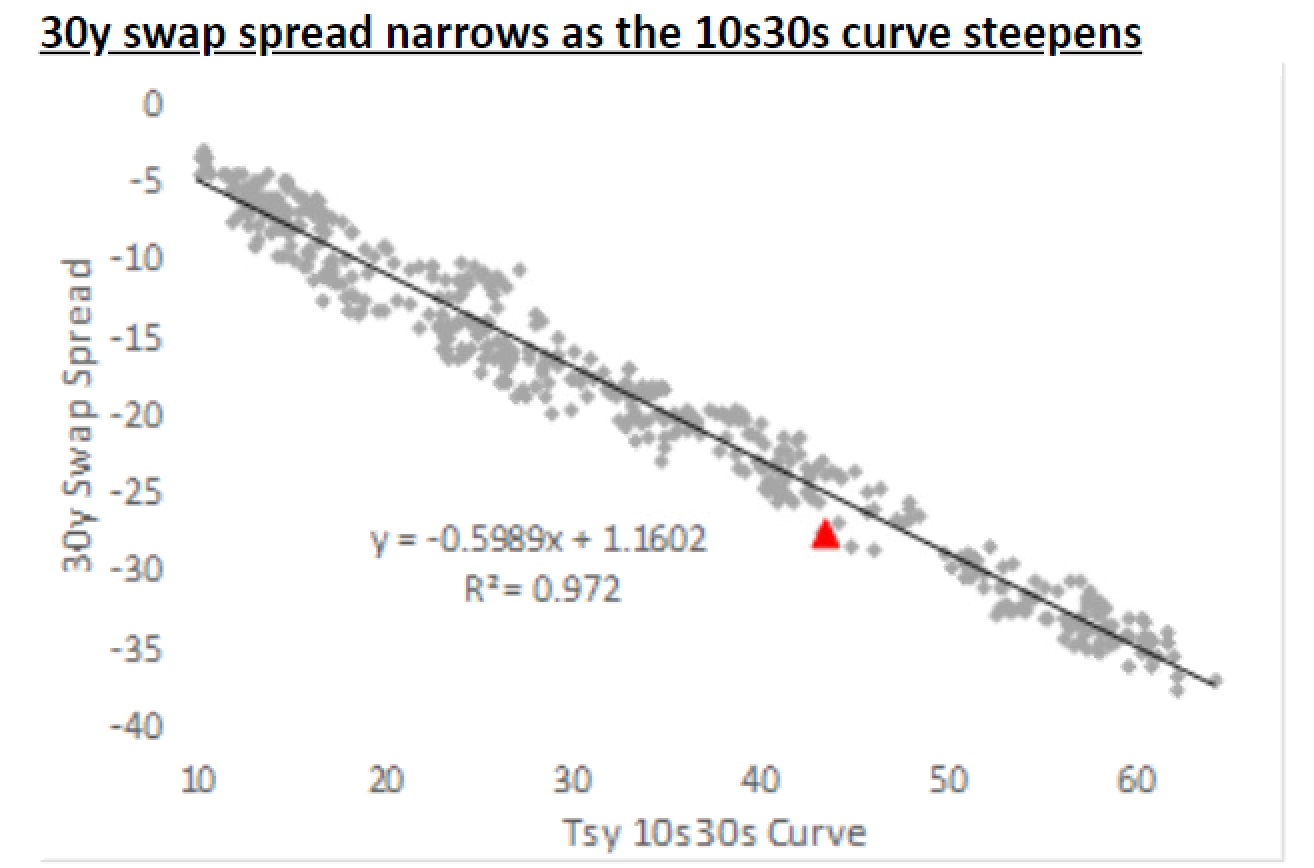
Societe Generale SA's head of U.S. rates strategy, Subadra Rajappa, emphasized some of the positioning quirks that were keeping the 30-year sticky, pointing to a reversal in tax-induced flows from pension funds. Liability-driven investors are likely getting their exposure to fixed-income in the swaps market as opposed to Treasuries, she says.
"This is clear in the strong correlation between the 30-year swap spread and 10s30s curve," Rajappa wrote. "Moreover, flight-to-quality flows tend to favor 5-year and 10-year Treasuries as oppose to the 30-year, which has contributed to the steepening of the 5s30s curve."
Credit Causality
There's a raging debate in credit about whether investors can't afford to be forward-looking or can't afford to be missing out.
JPMorgan Chase & Co.'s Bob Michele has warned that the rising probability of recession, as evidenced by the prolonged inversion of the 3-month, 10-year Treasury curve, could see default rates rise from below 2%, to 8%. He said he's selling rallies for the first time since the financial crisis.
"The chain of causality from credit to the economy means, in practical terms, that credit investors cannot wait for economic data to roll over before demanding more attractive investment terms," wrote Citigroup Inc.'s Daniel Sorid. "Instead, to avoid black eyes, credit investors must consider both the likelihood and severity of near-term economic shocks as well as the degree of vulnerability among issuers, and price this well in advance."
There's some embedded reflexivity here, which also cuts the other way: if credit markets can remain sufficiently tight, perhaps recession risks can be mitigated. Sorid notes this is exactly what the Fed is aiming for.
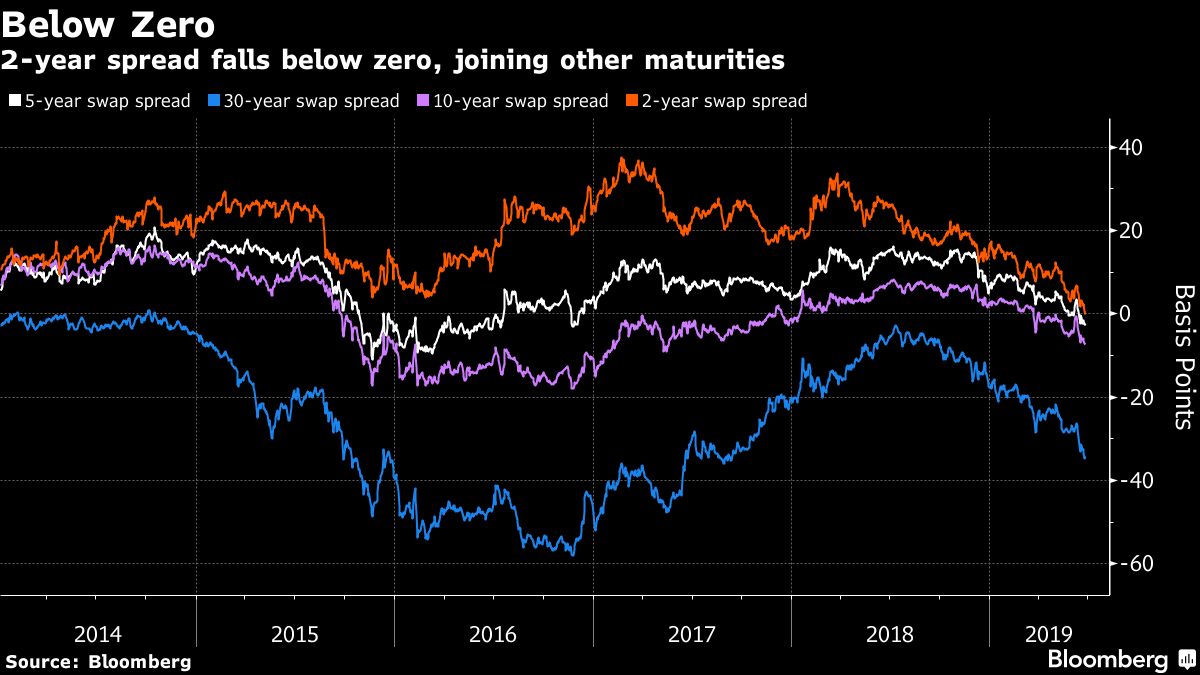
Hans Mikkelsen at Bank of America Merrill Lynch retains "high conviction" in spread tightening. In light of the elevated stockpile of global debt with a negative yield, "there is only one large, reliable source of yield for fixed income investors, which is the global corporate bond market," he concludes.
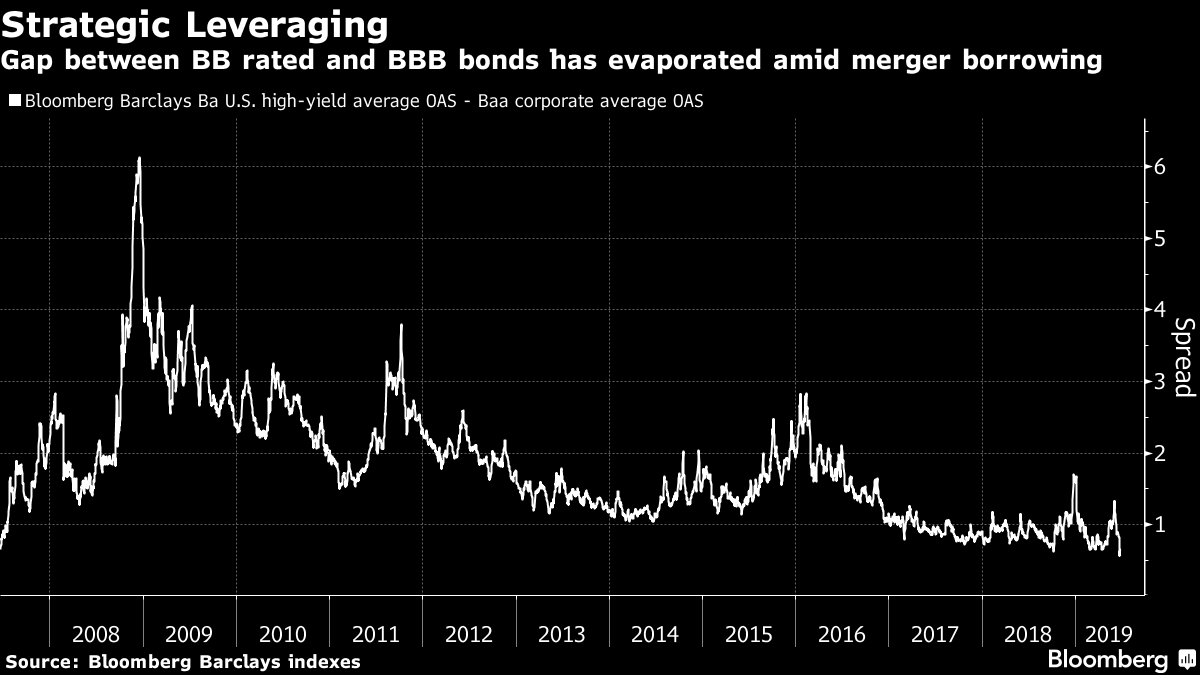
Talk about the complacency in credit often involves bringing up the winnowing spread between BBB (worst of the investment grade) and BB (best of the junk), which has shrunk to cycle lows.
First, it's important to note that, except at the front of the curve, spreads are still very wide at longer maturities.
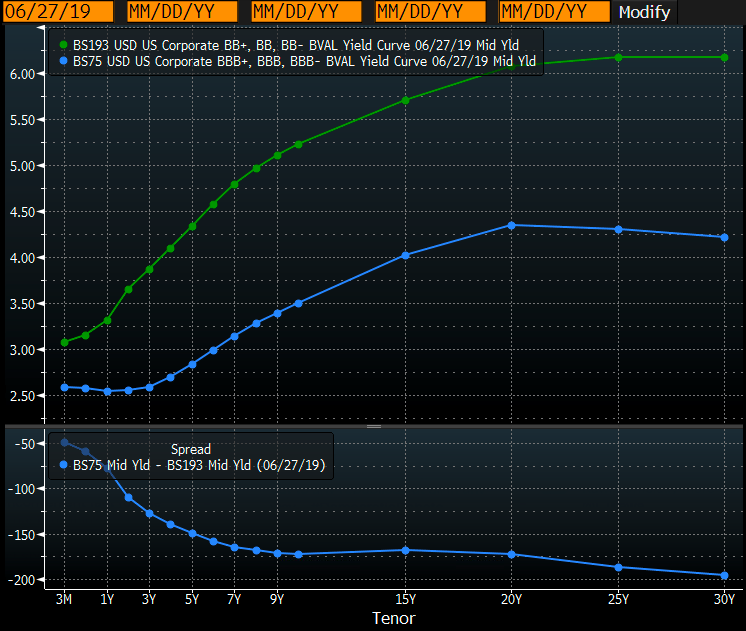
There's also amazing variety within the vast BBB universe. The spread, in aggregate, is roughly 150 basis points. Hundreds of issues in the Bloomberg Barclays Index are at less than half of that, and hundreds are above the 220 basis point spread where BBs are trading. Finally, the recent narrowing has occurred in the context of an oil price rally; explorers and producers have a much higher weighting in the junk index than high grade.
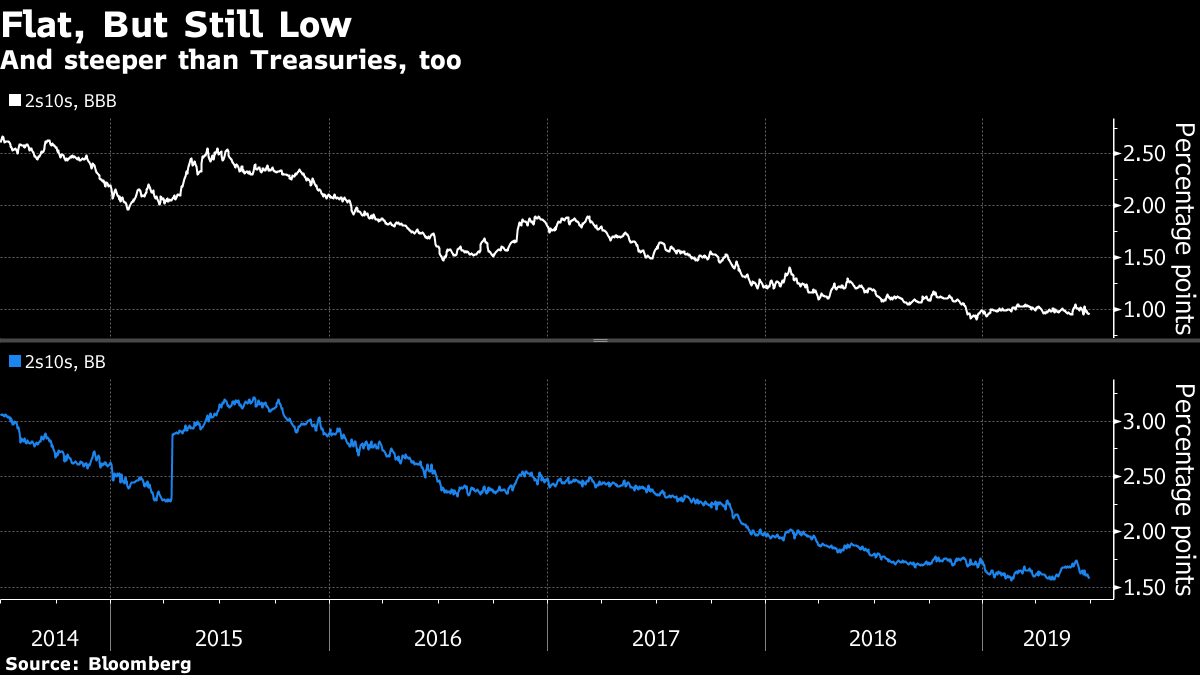
Companies are piling up debt because they aren't being punished for it, which gives them the opportunity to either expand, engage in shareholder-friendly activities, or reduce refinancing risk (if not business-cycle risk). Corporate curves (2s10s) are at cycle flats, but still materially steeper than the Treasury curve, both for BBBs and BBs. All-in 10-year borrowing costs are near their lowest levels over the past five years. On a relative basis, this further incentivizes terming out.
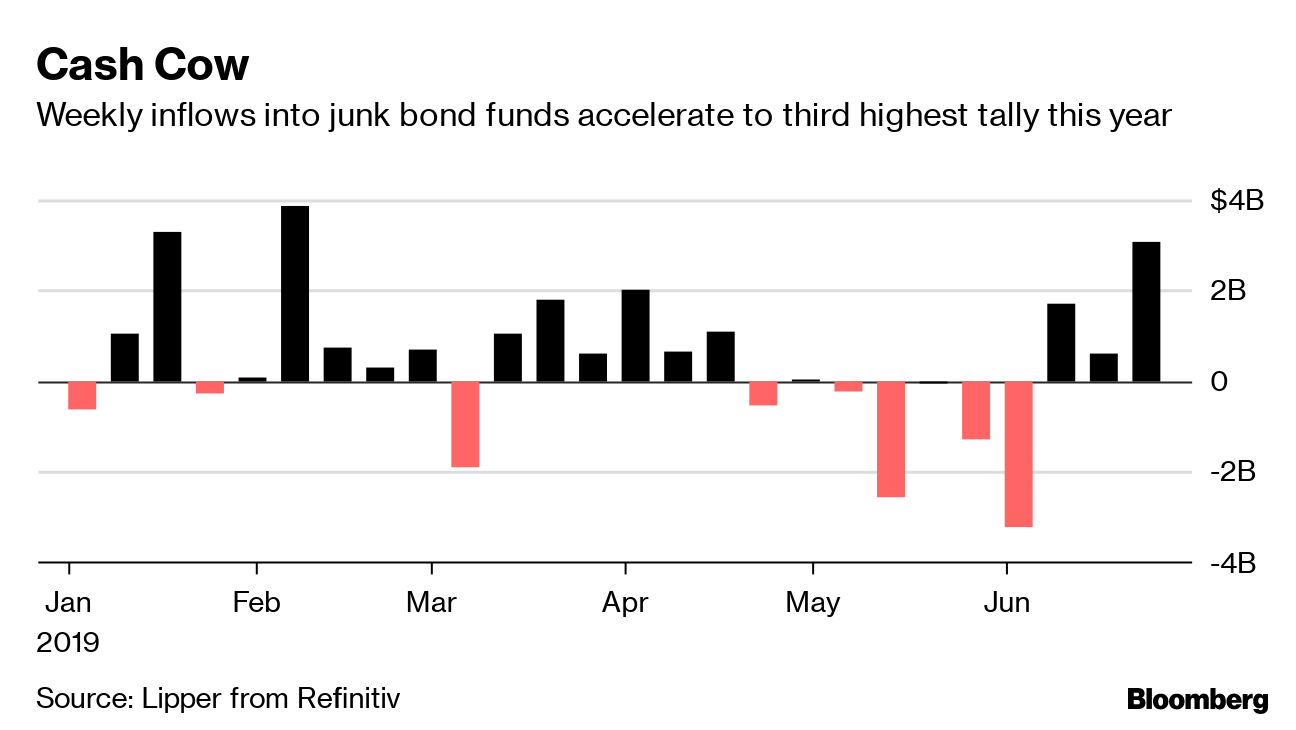
This kind of issuance action and what's expected to come (especially in high yield this year) seems to make it more likely that credit will be a symptom rather than a cause of any downturn. It helps that investors seem to be siding with Mikkelsen over the likes of Sorid and Michele, for the time being, by pumping money into junk bond funds as an issuance spree intensifies.



Post a Comment